
Volume 4 Issue 2
By By Daniel Oliver, King Edward VI Grammar School, Chelmsford
Citation
Oliver, D. (2024) Investigating the causes of coastal recession and consequences for Shoreline Management Plan policy decisions at Covehithe, Suffolk, UK. Routes, 4(2): 103-113.
Abstract
This paper focuses on understanding the causes and consequences of coastal recession, using the case study of the village of Covehithe, which has one of the highest rates of recession in the UK. Observations regarding the lithology and structure of the cliff material are made, and LiDAR data used to construct models of the cliff profile and beach wedge area to determine the coastline’s vulnerability to recession from marine and geological factors. The findings indicate recession which is driven predominantly by mass movement as a result of a lack of lithification and variable permeability, alongside removal of weathered sediment which would stabilise the cliffs through wave action. The Shoreline Management Plan is then evaluated, identifying that despite clear economic, social and cultural costs from a No Active Intervention policy, the implementation of coastal defences to protect coastal communities is simply not feasible along the whole of the UK’s coastline.
1. Introduction
Lopez et al. (2020) and Lee (2008) have conducted research in identifying the influence of the foreshore on recession rates along the East Anglian coastline. By analysing Beach Wedge Areas (BWAs), Lee argues that recession rates on a decadal scale are influenced by the size of the BWA, with an inverse relationship between the two. However, over shorter time scales this relationship is less clear, suggesting meteorological events may play a role in driving temporarily high rates of recession.
More recent research has sought to use remote sensing data, such as LiDAR and satellite imagery, to quantify the rate of recession and attempt to identify causes. Rogers et al. (2021) have developed a technique which utilises satellite imagery and a machine learning algorithm in order to detect recession rates based on shoreline vegetation position and allow more frequent collection of data. Spencer and Brooks (2020) focussed on the use of satellite imagery and geomorphological surveys to determine changes in recession, arguing that recession rates in areas of less resistant geology fluctuate significantly, with recession predominantly occurring during meteorological events.
The aim of this paper is to further investigate the causes of recession at Covehithe to understand the role of geological and marine factors. The existing Shoreline Management Plan will be assessed and re-evaluated to determine the suitability of the current policy. This will then be considered alongside the causes of recession to contextualise the policy decisions at Covehithe, and whether amendment is required.
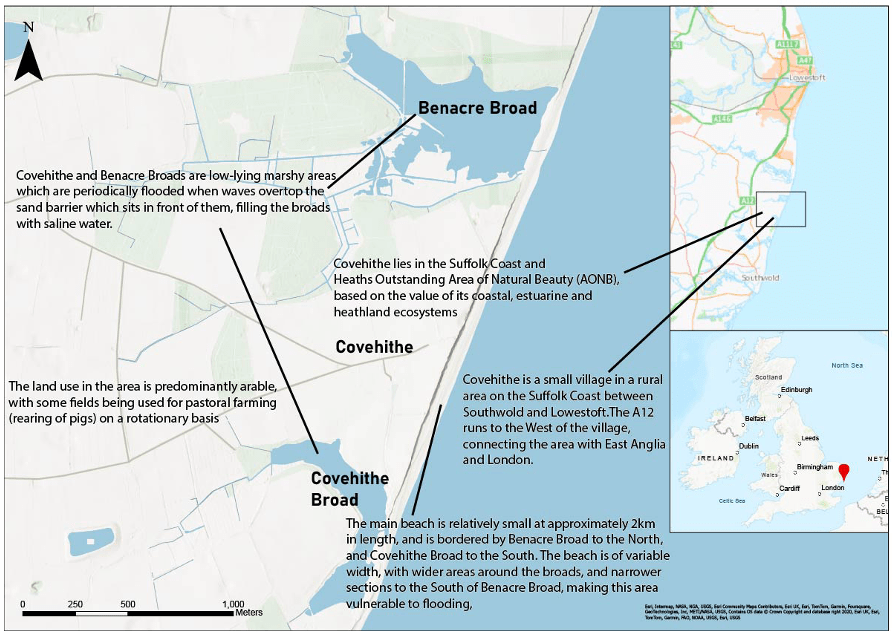
Figure 1 – map showing Covehithe’s location along the Suffolk coastline. Produced using Esri ArcGIS Pro (2024), using data from Ordnance Survey (2020)
2. Methodology and Data Collection
2.1 Data Collection Locations
Data was collected at sites along a 1km section of Covehithe’s coastline, as shown in Figure 2, in order to observe spatial patterns. Sites 1-3 and 5-7 were used for data collection in sections 2.1-2.4 (except where features such as cliffs were absent), whilst sites 4 and 7 were used for section 2.5.
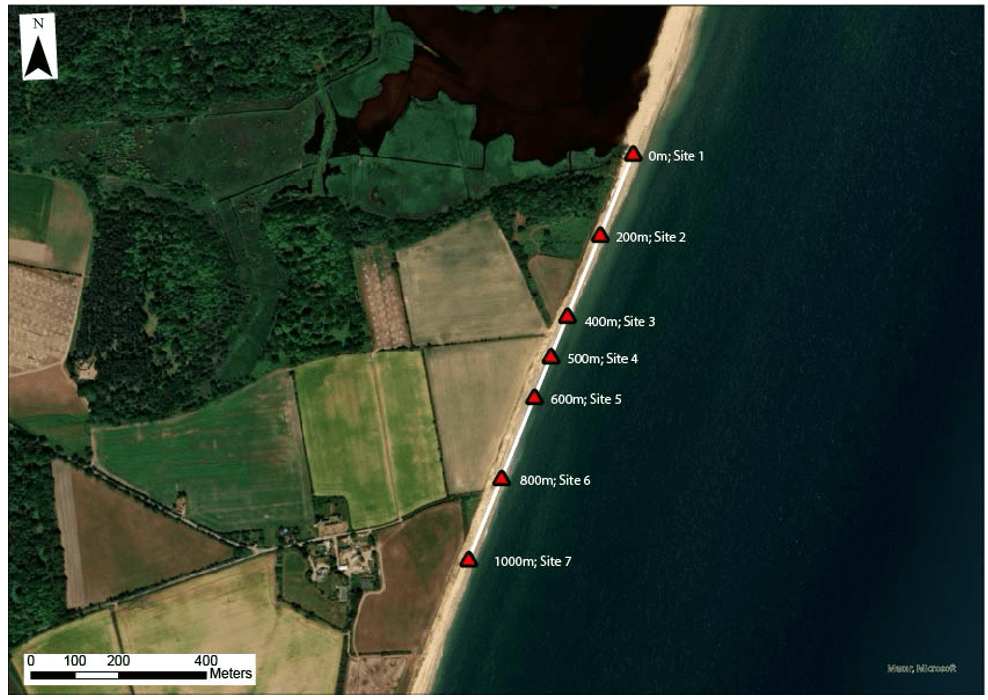
Figure 2 – Covehithe data collection sites. Produced using Esri ArcGIS Pro (2024), using data from Ordnance Survey (2022)
2.2 Cliff samples
Two samples were collected from loose material close to site 4 as shown on Figure 2, and then observed under a hand lens to record the lithology and structure of the material. This data will demonstrate whether the rock has less resistance, which may drive recession through increasing the susceptibility of the cliffs to erosion through marine or aeolian processes.
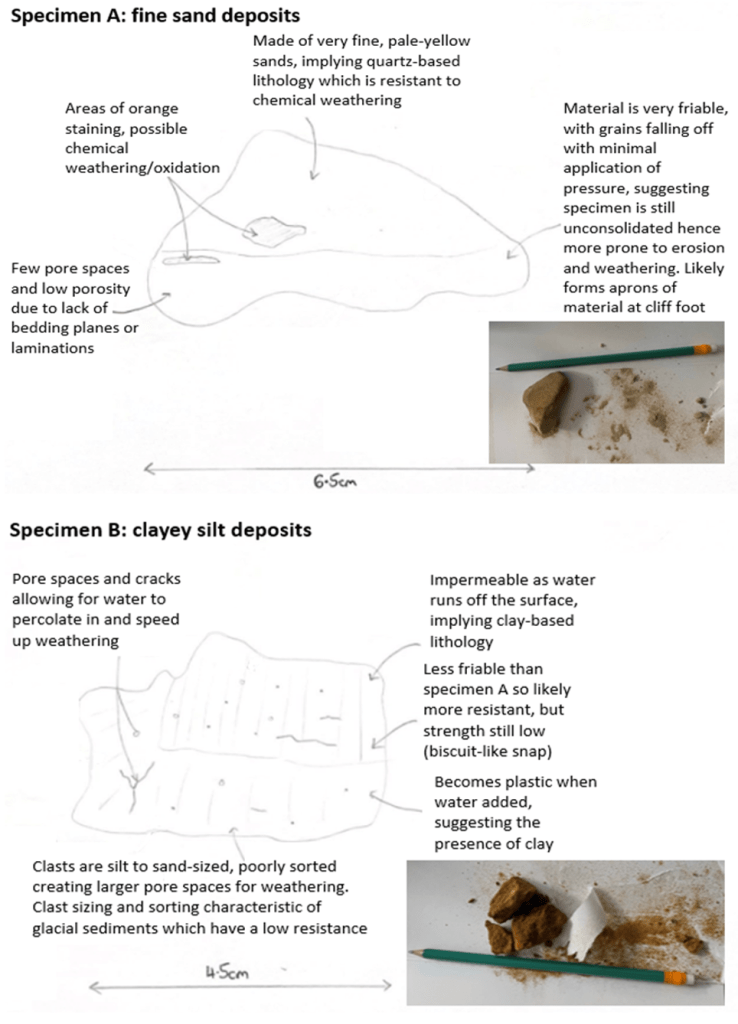
Figure 3 – analysis and comparison of the lithology and structure of specimens A and B collected from the foot of the cliffs
2.3 Cliff structure
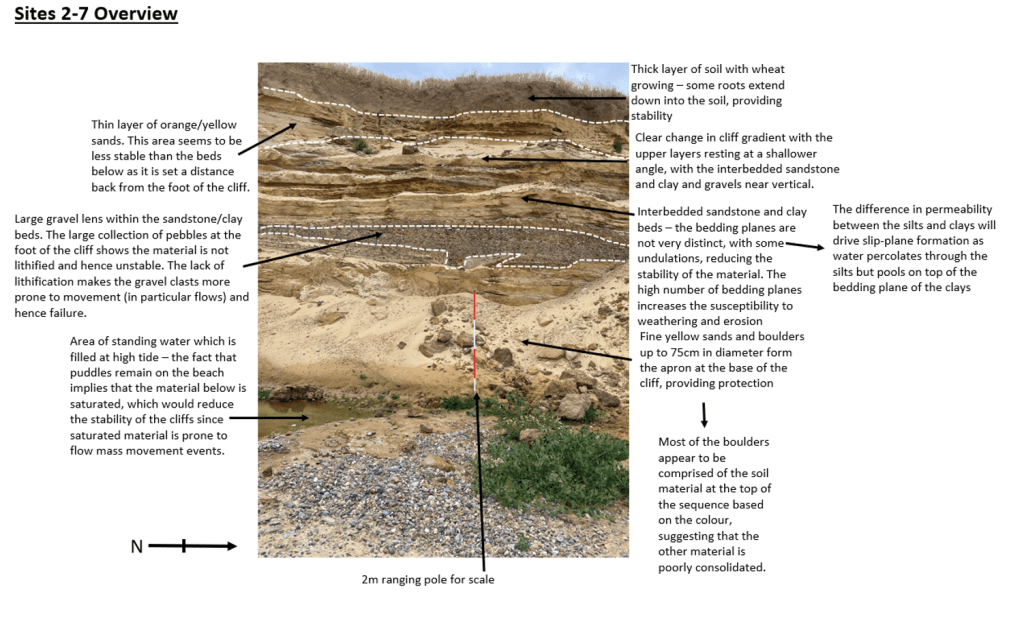
Figure 4 – Summary of findings regarding the cliff structure and lithology from Sites 2-7 at Covehithe. The image in the figure shows the cliffs at Site 7.
2.4 Cliff profile mapping
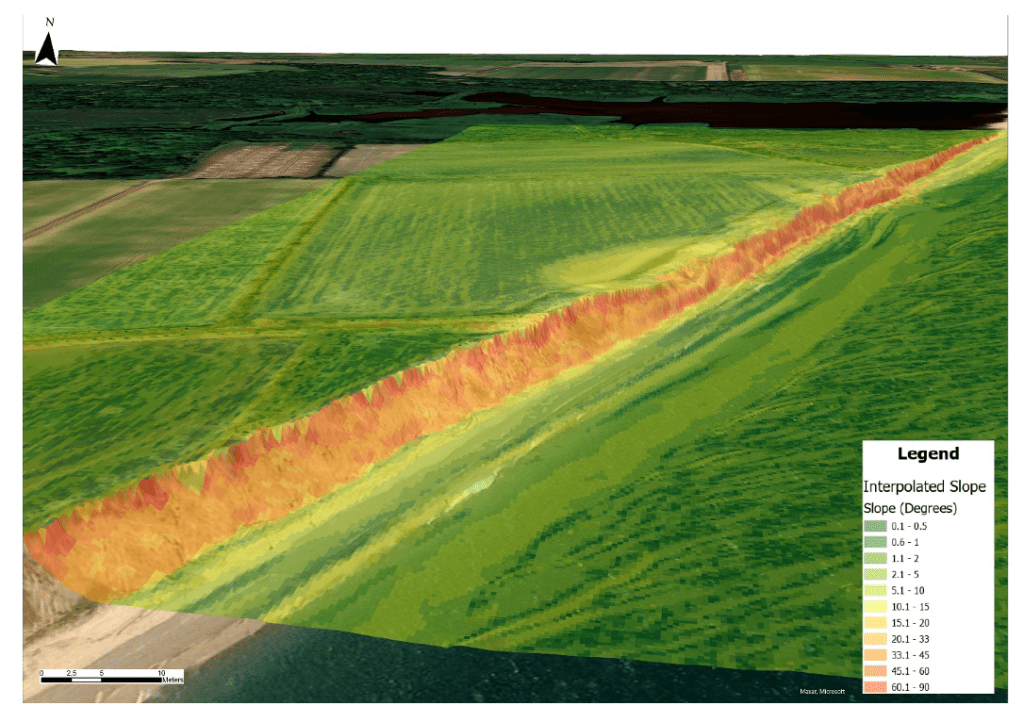
Figure 5 – 3D Model of the Covehithe Cliffs using the Digital Terrain Model from DEFRA (2022) and a slope raster interpolated from this dataset using Esri ArcGIS Pro (2024).
Sections were then cut through the cliffs, and the cliff height calculated as the elevation difference between the top of the cliff and where the slope reduced to less than 10 degrees. The overall cliff gradient was calculated as the angle between the the top and bottom of the cliff. Table 1 shows the results of the data.
| Site number | Cliff height (m) | Overall cliff gradient (Degrees) |
| Site 2 | 6.55 | 59 |
| Site 3 | 11.12 | 62 |
| Site 4 | 13.41 | 59 |
| Site 5 | 11.92 | 64 |
| Site 6 | 9.34 | 54 |
| Site 7 | 12.38 | 48 |
Table 1 – Cliff Profile Data
Figure 6 shows cross-sections of the profiles. The shallowing of the cliff gradient observed at sites 6 and 7 is likely due to the formation of the apron of material at the base of the cliffs, which although not part of the cliff mass, is formed of the cliff material and has a direct influence on cliff stability. In contrast, the lower height cliffs at sites 2 and 3 have a more continuous and steeper cliff gradient, with less material protecting the cliff foot.
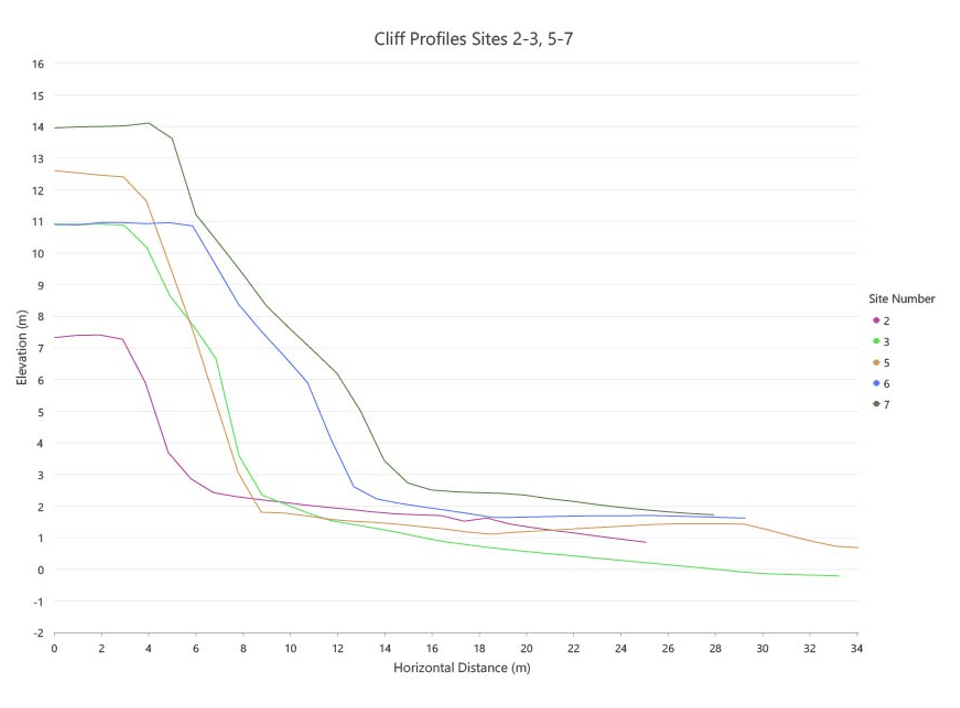
Figure 6 – line graphs showing cliff profiles at sites 2-3 and 5-7 at Covehithe. Producing using Esri ArcGIS Pro (2024), using data from DEFRA (2022) and Ordnance Survey (2022).
2.5 Cliff instability assessment
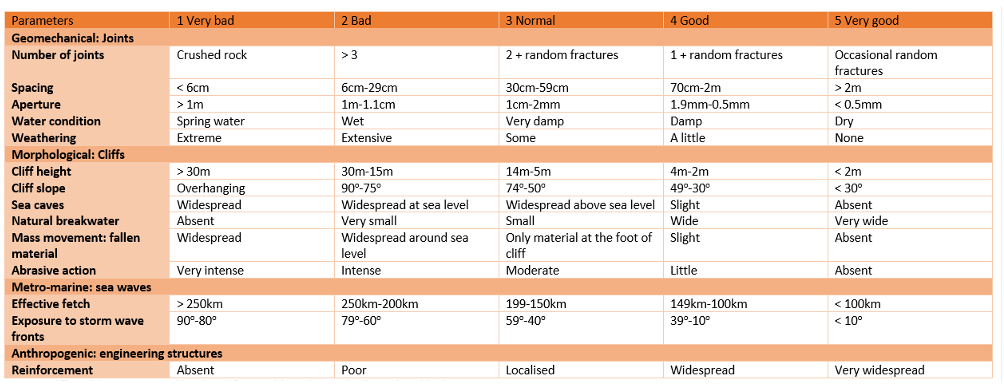
Table 2 – Cliff instability assessment table, adapted from work by Andriani and Pellegrini (2014) by Maddison (2018)
| Site 4 | Site 7 | |
| Number of joints | 5 | 3 |
| Spacing | 5 | 2 |
| Aperture | 5 | 3 |
| Water condition | 4 | 4 |
| Weathering | 2 | 2 |
| Cliff height | 3 | 3 |
| Cliff slope | 3 | 4 |
| Sea caves | 5 | 5 |
| Natural breakwater | 2 | 3 |
| Mass movement: fallen material | 3 | 3 |
| Abrasive action | 3 | 3 |
| Effective fetch | 1 | 1 |
| Exposure to storm wave fronts | 4 | 4 |
| Reinforcements | 1 | 1 |
| Total score | 46 (Partially stable) | 41 (Partially stable) |
Table 3 – Cliff Instability Assessment results
2.6 Beach profile mapping and beach wedge area calculations
To assess the degree of protection afforded to the cliffs from wave action, the BWA was calculated along the transect. Using the DEFRA DTM (2022), beach profiles were calculated at 50m intervals to the South of Benacre Broad, and the cross-sectional area between the cliff foot and Mean High-Water mark (as defined by Ordnance Survey (2024)) calculated. Figure 7 shows the results of the BWA calculations along the transect.
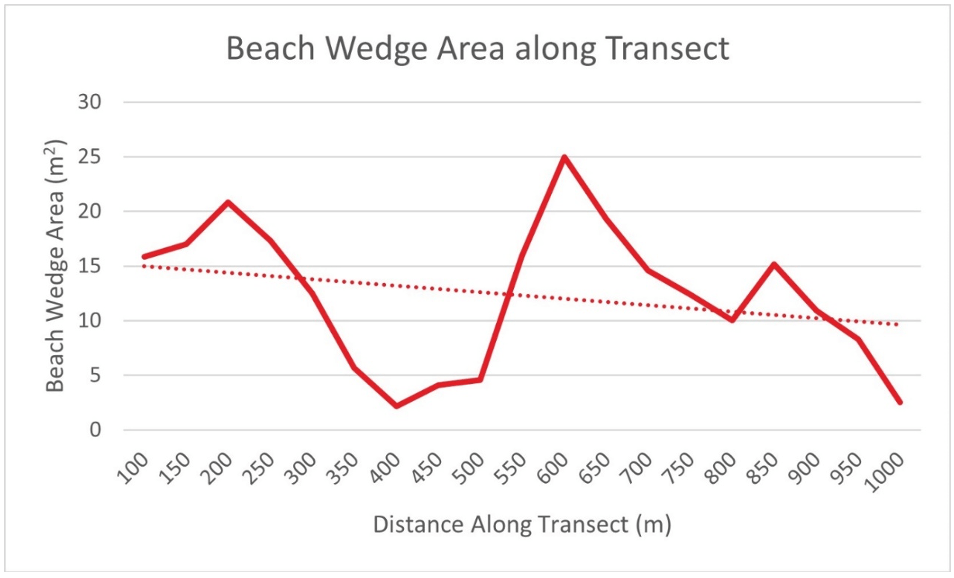
Figure 7 – line graph of beach wedge area calculated along the 1km transect at Covehithe beach. NB distance starts at 100m due to Benacre Broad influencing the beach depth for the first 100m of the transect. Produced using data interpolated from DEFRA (2022) and Ordnance Survey (2022), using Esri ArcGIS Pro (2024).
3. Discussion
The loosely consolidated nature of the material plays a key role in driving coastal recession, since the lack of lithification observed in the collected samples indicates the rock has a low mechanical strength and is therefore vulnerable to aeolian erosion, which Chapman (2014) views as more important than the cliff profile. The superficial deposits at Covehithe are formed of the Happisburgh Glacigencic Deposits (British Geological Survey, 2024), with the fine clast sizes and lack of lithification typical of Quaternary deposits. This contributes towards the aprons of material which form at the cliff foot, providing protection from marine erosion. The flint and quartzose lithology of much of the clastic material (McMillan, Hamblin and Merritt, 2011; Lee, et al., 2004) suggests potential resistance to marine erosion. Furthermore, the presence of the interbedded sandstone and clay supports the findings of Moorlock et al. (2000), as the difference in permeability between the two lithologies would likely drive slumping, which could explain the reduced cliff gradient observed at Sites 6-7.
The classification of the cliffs as ‘partially stable’ based on the methodology by Andriani and Pellegrini (2014) is particularly driven by the ‘fetch’ and ‘degree of weathering’. The high degree of weatheringwill undermine the stability of the cliffs by reducing the mechanical strength of the deposits, enabling an accelerated rate of mass movement and erosional processes, whilst the long fetch suggests rapid recession could occur during storm events as beach sediment is depleted and the cliffs are more vulnerable to direct attack from large waves.
With a range of over 22m2 in the BWA across the 1km transect, the degree of sediment protection to the cliffs at Covehithe is clearly varied. Lee (2008) found a correlation between lower BWAs and higher recession rates, potentially causing irregular rates of recession along the coastline. Lee also identifies that areas with a BWA below 20m2 have a significant increase in recession rate. Given that only 10.5% of values show a BWA over 20m2, this suggests significant vulnerability along this stretch of coastline, accounting for the high recession rate.
Overall, the driver of recession is likely a combination of weak and unstable cliffs alongside significant marine erosion scouring the beach. The low BWA identified suggests there is minimal sediment to protect the cliffs from erosion, and sediment which is released because of mass movement processes is quickly scoured from the beach. Meanwhile, the unstable nature of the cliffs causes repeated mass movement as slip planes form between the deposits, leading to the cliff top retreating even outside of storm events.
4. Evaluating the Shoreline-Management Plan
4.1 Historical recession rates
This section will focus on the coastline from Benacre Broad to Covehithe Broad. Using Ordnance Survey maps and satellite imagery, historical coastlines were digitised, and the recession rate calculated at 50m intervals and then averaged. Table 4 below shows the results. This data was then divided into polygonal areas using the 50m intervals to identify spatial trends in the recession rate, shown in Figure 8.
| Time Period | Distance Coastline Receded Per Year (m) (3 sf) | Area Lost Per Year (m2) |
| 1903-1945 | 4.786 | 8512 |
| 1945-1999 | 4.753 | 8503 |
| 1999-2017 | 3.770 | 6627 |
| 2017-2022 | 2.638 | 4672 |
Table 4 – Recession rates over time at Covehithe
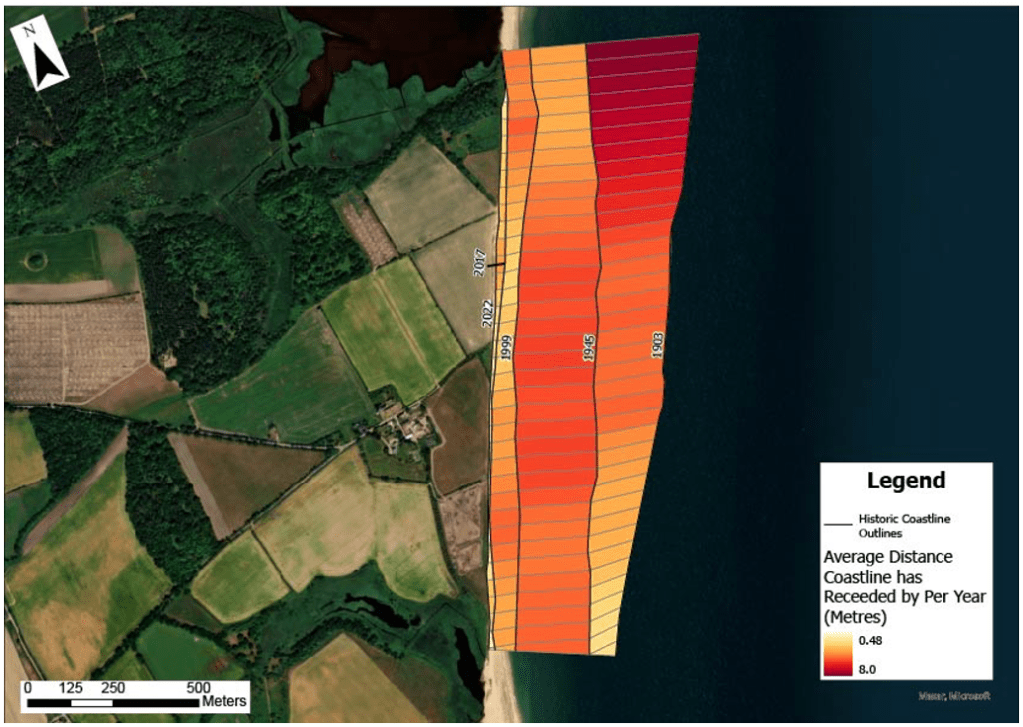
Figure 8 – Historic recession rates at Covehithe between 1903 and 2022. Produced using Esri ArcGIS Pro (2024), using data from Ordnance Survey (1899) and Google Earth (2024).
The data shows a consistent erosion rate from 1903-1999 of around 4.7m per year, with a decrease observed since 1999. However, these results should be treated with caution, since the more recent data uses shorter time periods and hence is influenced more by variations in the rate. The decrease in the recession rate indicates the rate in recession is highly volatile, and that recession occurs predominantly in intense, short periods, as proposed by Spencer and Brooks (2020), rather than at a continual rate. Figure 8 demonstrates how the rate of recession has varied in some areas over time, suggesting that beach replenishment from the cliffs could be reducing the recession rate.
4.2 Cost-Benefit Analysis (CBA)
In order to evaluate the SMP policy, a CBA was performed, using agricultural land value data from the FWI (2022) and house price data from Zoopla (2024) to determine the economic case for coastal defences.
The FWI category of ‘poor’ was equivalated to Grade 4 Arable under the DEFRA Agricultural Land Classification. The FWI data is a Suffolk-wide average based on a 2021 survey, and hence does not account for recent inflation. The value of the woodland lost, or potential costs associated with the relocation of St Andrew’s Church has not been accounted for due to uncertainties with the value of these land uses.
Table 5 shows the results of these calculations, whilst Figure 9 shows the land classifications of the study area based on a visual appraisal, and predicted future coastlines as defined in the SMP, demonstrating the clear impact on agricultural land, as well as residential land in the medium and long-term epochs.
| Epoch | Land Use Type | Amount of land lost (ha) | Economic value of lost land (£) |
| Short Term (0-20 Years) | Agriculture – Grade 4 | 11.199 | 101,631 |
| Broads | 2.791 | 0 | |
| Road | 0.602 | 0 | |
| Woodland | 1.962 | 0 | |
| TOTAL | 16.554 | 101,631 | |
| Medium Term (20-50 Years) | Agriculture – Grade 4 | 16.518 | 146,634 |
| Broads | 4.244 | 0 | |
| Buildings (Residential and Commercial) | 0.671 | Unknown – farm storage/barn areas | |
| Road | 0.106 | 0 | |
| Woodland | 2.358 | 0 | |
| TOTAL | 23.897 | 146,634 | |
| Long Term (50-100 Years) | Agriculture – Grade 4 | 26.178 | 237,565 |
| Broads | 8.537 | 0 | |
| Buildings (Residential and Commercial) | 1.497 | 1,904,000 | |
| Road | 0.258 | 0 | |
| St Andrew’s Church | 0.675 | 0 | |
| Woodland | 2.409 | 0 | |
| TOTAL | 39.554 | 2,141,565 | |
| SMP Timescale (0-100 Years) | TOTAL | 80.005 | 2,389,830 |
Table 5 – Cost-Benefit Analysis at Covehithe
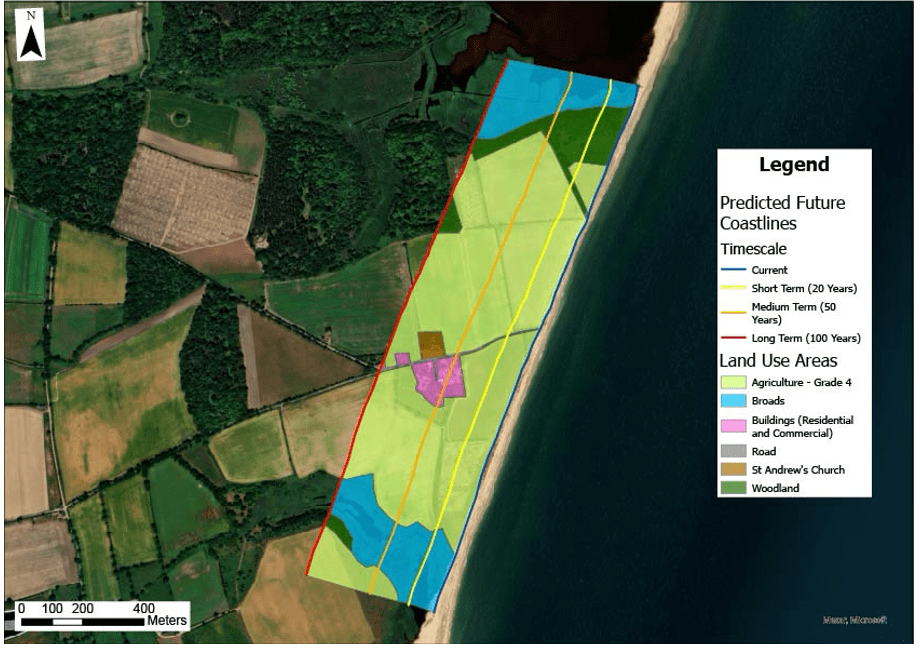
Figure 9 – map showing loss of agricultural land at Covehithe by 2105. Produced using Esri ArcGIS Pro (2024), using data from Defra (2019), Ordnance Survey (2022) and Suffolk Coastal District Council, Waveney District Council and Environment Agency (2010)
Based on economic factors alone, there is no clear case for implementing coastal defences and changing the SMP policy due to the lack of economic benefit. Implementing defences to slow the rate of recession would only save around £2.3 million over 100 years, and achieving a positive cost-benefit ratio would be challenging with the limited budget for defences afforded by the low economic costs.
However, policymakers also need to consider other non-economic factors, such as the mental impacts of residents losing their homes, and cultural damage from the loss of St Andrew’s church. Whilst these are more challenging to quantitatively assess (and hence more difficult to appraise objectively), it is important that social and cultural impacts are considered, although with only five households impacted, the case for defences from a social perspective is minimal.
5. Conclusion
The findings of this paper show that the causes of recession at Covehithe are complex and driven by multiple factors, with the cliffs being classified as only Partially Stable. The lack of lithification and variable permeability identified in the cliff samples and cliff structure notes aligns with the view of Moorlock et al. (2000) that recession of the cliffs at Covehithe is predominantly driven by mass movement. Yet as noted by Chapman (2014), Lee (2008) and Spencer and Brooks (2020), marine factors also play an important role, since wave action is likely responsible for removing mass movement produced sediment from the beach, leading to the observed low beach wedge areas, with just 10.5% of the coastline having a beach wedge area above 20m2, reducing protection of the cliffs. This paper has also shown the value in remote sensing data, in particular LiDAR, and Geographic Information Systems in understanding and efficiently and accurately modelling the nature of cliffs and beaches in order to identify potential causes for recession. Whilst there are clear social, economic and cultural impacts from the current No Active Intervention policy at Covehithe, the Cost-Benefit Analysis found these are not unjustified given the small scale of these impacts. This demonstrates that whilst efforts should always be made to protect coastal communities, policy makers need to consider that not all of the UK’s coastline can be protected from the threat of recession, and that resources need to be targeted towards areas facing greater impacts.
Acknowledgements
I would like to express my gratitude to the Geography Department at KEGS for their assistance in loaning equipment and resources, as well as providing guidance in the drafting of this paper.
References
Andriani, G. F. & Pellegrini, V. (2014) ‘Qualitative assessment of the cliff instability susceptibility at a given scale with a new multidirectional method.’, International Journal of Geology, 8, pp. 73-80.
British Geological Survey. (2024) Geology viewer. [Online] Available at: https://geologyviewer.bgs.ac.uk [Accessed 7 September 2024].
Chapman, N. (2014) Modelling the dynamic interaction between hydrology, slope stability and wave run-up processes in the soft-sea cliffs at Covehithe, Suffolk, UK. London: Birkbeck University of London.
DEFRA (2019) Provisional Agricultural Land Classification (ALC) (England). [Online]
Available at: https://www.arcgis.com/home/item.html?id=5d2477d8d04b41d4bbc9a8742f858f4d [Accessed 1 September 2024]. Used under Open Government Licence V3.0.
DEFRA (2022) LIDAR Composite Digital Terrain Model Tile TM58sw. [Online] Available at: https://environment.data.gov.uk/survey [Accessed 11 August 2024]. Used under Open Government Licence V3.0.
Esri. (2024) ArcGIS Pro. [Online] Available at: www.arcgis.com. Maps throughout this report were created using ArcGIS® software by Esri. ArcGIS® is the intellectual property of Esri and is used herein under license. Copyright © Esri. All rights reserved. For more information about Esri® software, please visit www.esri.com
FWI (2022) Find out average farmland prices where you live. [Online] Available at: https://www.fwi.co.uk/business/markets-and-trends/land-markets/find-out-average-farmland-prices-where-you-live [Accessed 1 September 2024].
Google. (2024) Google Earth. Mountain View: Google.
Lee, E.M. (2008) ‘Coastal cliff behaviour: Observations on the relationship between beach levels and recession rates’, Geomorphology, 101(4), pp.558-571.
Lee, J. R. et al. (2004) ‘A new stratigraphy for the glacial deposits around Lowestoft, Great Yarmouth, North Walsingham and Cromer, East Anglia, UK.’, Bulletin of the Geological Society of Norfolk, 53, pp. 3-60.
Lopez et al. (2020) ‘A Method to Extract Measurable Indicators of Coastal Cliff Erosion from Topographical Cliff and Beach Profiles: Application to North Norfolk and Suffolk, East England, UK’ Journal of Marine Science and Engineering, 8(1), Article 20.
Maddison, J. (2018) ‘Cliff Surveys’ in A Level Geography Creative Fieldwork. Shrewsbury: Field Studies Council.
McMillan, A. A., Hamblin, R. J. O. & Merritt, J. W. (2011) A lithostratigraphical framework for onshore Quaternary and Neogene (Tertiary) superficial deposits of Great Britain and the Isle of Man., Keyworth: British Geological Survey. pp. 343.
Moorlock, B. et al. (2000) Geology of the country around Lowestoft and Saxmundham, Keyworth: British Geological Survey.
Ordnance Survey (2022) OS MasterMap Topography Layer [FileGeoDatabase geospatial data], Scale 1:1250. Download using EDINA Digimap Ordnance Survey Service https://digimap.edina.ac.uk [Accessed 6August 2024] Contains Ordnance Survey Data. Crown Copyright and Database Rights 2022.
Ordnance Survey (1889), Sheet 176 – Lowestoft [Map]. 1 inch:1 mile. Southampton, England: Ordnance Survey.
Rogers et al. (2021) ‘VEdge_Detector: automated coastal vegetation edge detection using a convolutional neural network’, International Journal of Remote Sensing, 42(13), pp. 4805-4835.
Spencer, T. and Brooks, S. (2020) ‘Soft rock cliff retreat under changing climate drivers’, EGU General Assembly 2020, Online, 4-8 May 2020.
Stanley, R. & Staley, P. (2017) Cliff recession in the Anglian Coastal monitoring area: report, Bristol: Environment Agency.
Suffolk Coastal District Council; Waveney District Council; Environment Agency. (2010) Suffolk SMP2 Sub-cell 3c, Lowestoft: Suffolk’s SMP2.
Zoopla. (2024) House Prices in Covehithe. [Online] Available at: https://www.zoopla.co.uk/house-prices/cove-hithe/street/nr34-7jw/?q=nr34%207jw [Accessed 25 August 2024].
#Write for Routes
Are you 6th form or undergraduate geographer?
Do you have work that you are proud of and want to share?
Submit your work to our expert team of peer reviewers who will help you take it to the next level.
Related articles
