
By Edward Jones (Geography Teacher at Buxton Community School)
Citation
Jones, E. (2022) Landscape assessment: A useful tool for A Level enquiry. Routes 2(2): 91-101
Abstract
Place and the perceptions of this has become a focus of Geography at A Level. Whilst much has been written on this topic, this paper recognises the forgotten voice of landscape assessment through a study of 250 A Level Geography students. These students were taught over a period of 2 months at FSC Epping Forest, in May and June 2018, whilst visiting the field centre as part of their Non-Examined Assessment (NEA). For this, the relationship between subjective and objective landscape assessment was investigated, within Epping Forest, using an adapted version of Swetnam et al.’s (2017) Visual Quality Index (VQI). This paper provides an overview of wider landscape assessment issues and theories, alongside an introduction to the mechanics behind the VQI. A case study is presented from Epping Forest to illustrate how A Level students benefited from completing the VQI. The wider implications of this research include not only the use of the VQI as a fieldwork tool for A Level Geographers conducting the NEA, but at any stage where an unfamiliar landscape is being approached.
1. Introduction
1.1 Young people and landscape assessment
Landscapes and place both form a key aspect of the geography curriculum at secondary school. At GCSE, it is expected that students should develop an understanding of the UK’s geography, through the study of both its physical and human landscapes (DfE, 2014a). At A Level, this splits into two more distinct threads; landscapes and place. Landscapes at A Level focus on how landforms and processes make up characteristic landscapes and how these vary on both a spatial (landform to landscape) and temporal (seconds to millenia) scale (DfE, 2014b). A Level place studies on the other hand require students to look at how connections affect our understanding of place and how it changes because of this (DfE, 2014b). Such concepts are viewed by Castree (2003) as being some of the most difficult in geography, with this issue being further compounded by the fact students will be coming across both familiar and unfamiliar landscapes in their studies. In order for students to fully understand these landscapes then, it is important that they are equipped with the tools to assess the characteristics of them.
Despite this, previous landscape studies highlight that the young (<25 years) is in fact a marginalized voice in landscape assessment. With only 93 (=4.1%) respondents out of 2263 participants being under 25; Swetnam et al. (2015) highlight this with their landscape preference survey of Wales. Given the ever-changing nature of the world, this knowledge gap in landscape assessment is a concern given evidence from previous studies revealing variation in landscape preference can be caused by both age and familiarity (Kaplan & Kaplan, 1989; Daniel, 2001). Lyons (1983) and Daniel (2001) further support the notion that preference changes with age, with little evidence to support the view that landscape preference is shaped by innate factors. Further age-related changes to preference have been illustrated by Zube et al. (1983) and Bernaldez et al. (1987), their studies indicating younger children rate landscapes differently from adults. It is important therefore that models of landscape assessment recognise landscapes as stimuli that generate responses based on experience and familiarity (Kaplan & Kaplan, 1989; Daniel, 2001). This is a pertinent issue given the size of children’s home range has reduced with childhood moving indoors (Driessnack, 2009; Wooley & Griffin, 2015). This has potential ramifications for how the young perceive landscapes.
1.2 Expert and perception-based landscape quality assessment
Whilst recognising place is born out of the interaction between biophysical landscape components (e.g. rivers, trees, mountains) and perceptual processes of humans; landscape quality assessments have traditionally been divided into two paradigms. Daniel (2001), Lothian (1999), and Palmer & Hoffman (2001) state these two paradigms are expert (objective) assessments; and perception (subjective) based models. With the public ultimately consumers of spaces, perception-based models reflect how meaning is attached to place. Increased familiarity has been shown to lead to greater variance in responses to preference (Kaplan & Kaplan, 1989). Whilst perceived landscape quality is in the eye of the beholder, it is believed many have similar perceptions due to common cultural and personal experiences or biological heritage (Palmer & Hoffman, 2001). This means that the reliability of this type of assessment is often greater than objective methodologies. Despite this, it can be questioned as to whether such methodologies provide valid results of true landscape quality (Daniel, 2001). Instead, it is best to consider these methods as signifying perceived landscape quality.
By contrast, expert-based approaches translate biophysical components into formal parameters (Daniel, 2001; Swetnam et al., 2017). Landscapes are classified on numerical scales with presumptions made that features (e.g., mountains and rivers) have inherent quality (Lothian, 1999; Swetnam et al., 2017). Such methods are replicable, allowing comparison both temporally and spatially. Whilst an invaluable tool in landscape assessment, objective methodologies have been criticised for their inadequate reliability and precision. Often objective methodologies are carried out by one researcher, bringing into question the reliability of an individual’s landscape quality judgements (Frank et al., 2013; Kaplan, 1988; Palmer & Hoffman, 2001). These are instead based on the assumption that there is such thing as an ‘objective’ view of landscape, Kaplan (1988) noting that the assessment cannot always cater for the subjectivity of evaluating landscapes; with landscape quality measurements varying between ‘experts’ as between landscapes (Daniel, 2001).
1.3 Co-dependent landscape quality assessment
Recently, the two models outlined above have begun to show signs of merging into an effective methodology that addresses the co-dependency of perceptual processes and landscape features (Daniel, 2001; Swetnam et al., 2017). One such method, the Visual Quality Index (VQI) is a predominantly objective measure of visual landscape quality originally developed for Welsh landscapes, with the methodology having previously been published in detail (see Swetnam et al., 2017) and adapted for other environments such as Iceland (see Swetnam & Tweed, 2018).
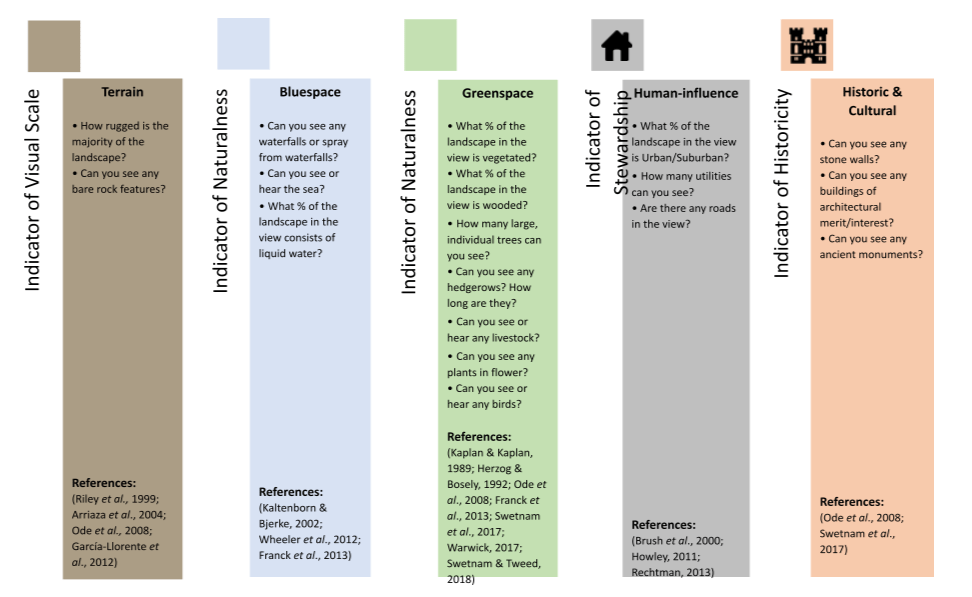
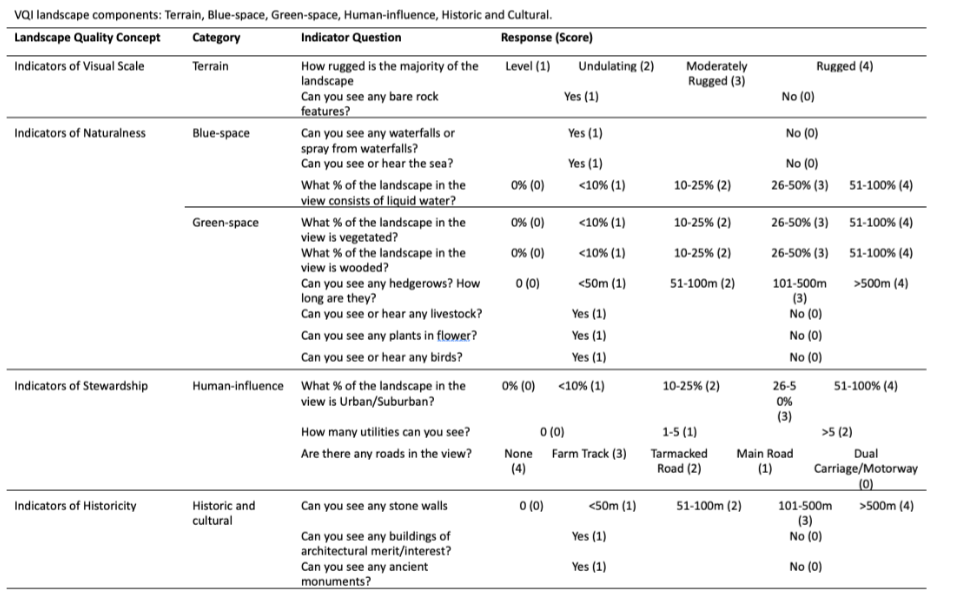
The VQI recognises five thematic components: terrain, blue-space, green-space, built and historic. Each of these thematic components are further divided into measurable landscape components (Figure 1), with positive and negative impacts on the visual landscape. A full break down of indicator questions and visual quality scores can be found in Appendix 1. In their raw form, the results of the five thematic landscape components set out in Figure 1 are not equal due to differing number of parameters within each component (Swetnam et al., 2017). To move from raw data to the Visual Quality Index score, the values are totalled, then scaled and weighted to provide an index for each site between 0 and 1 (Swetnam et al., 2017). With the weighting attached for each landscape component, the overall landscape is given an objective visual quality score with a final possible value ranging from 0 (low quality) to 1 (high quality).
Previous landscape studies have illustrated significant positive correlations between subjective and objective landscape quality scores (Ode et al., 2008; Ode et al., 2009; Frank et al., 2013; Swetnam et al., 2017; Swetnam & Tweed, 2018). It remains to be seen however whether this holds true for younger individuals.
2 Detailed overview of the VQI
2.1 VQI for fieldwork
This research aimed to use an adapted version of the VQI to assess young people’s perceptions of landscapes during A Level fieldwork. These would be compared with a preference survey to see if the previous correlation between subjective and objective landscape quality is present in young people. The VQI used is a predominantly objective measure of visual landscape quality originally developed for Welsh landscapes, with the methodology having previously been published in detail (see Swetnam et al., 2017). The VQI recognises five thematic components: terrain, blue-space, green-space, built and historic. Each of these thematic components are further divided into measurable landscape components (Figure 1), with positive and negative impacts on the visual landscape. A large body of research exists for the inclusion of the various categories, with references for these in Figure 1. A full break down of indicator questions and visual quality scores can be found in Appendix 1. With the weighting attached for each landscape component, the overall landscape would be given a visual quality score with a final possible value ranging from 0 (low quality) to 1 (high quality).
In their raw form, the results of the five thematic landscape components set out in Appendix 1 are not equal due to differing number of parameters within each component (Swetnam et al., 2017). In order to move from raw data to the Visual Quality Index score, the values are totalled, then scaled and weighted to provide an index for each site between 0 and 1 (Swetnam et al., 2017). An equal weighting of 0.2 for each component was used during this project. In using equal weights, it is assumed the landscape components contribute equally to overall visual landscape quality, whilst this is known to not be the case in Epping Forest, a landscape dominated by green-space. Previous sensitivity analysis conducted by Swetnam et al. (2017) however revealed overall VQI score remained stable when changes to landscape category weights remained within the 0.1-0.4 range.
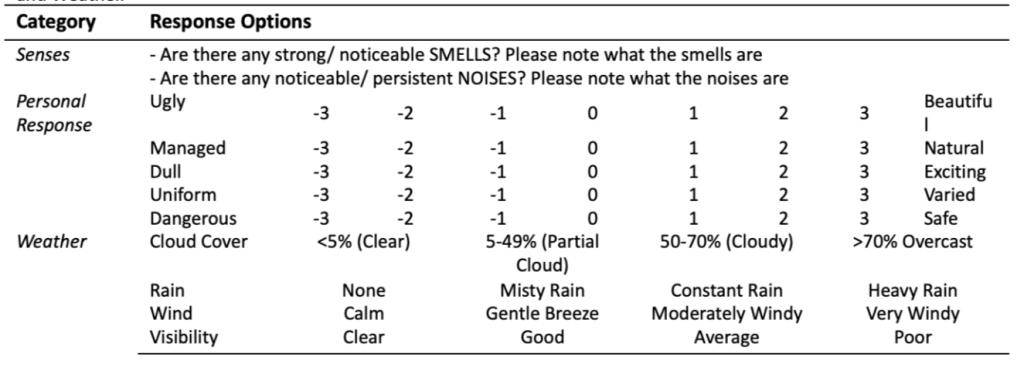
As discussed earlier, there is a substantial body of research on the aesthetic appeal of landscapes. In a similar vein to (Swetnam & Tweed, 2018) this version of the VQI required to record measures of personal landscape appeal as well as ephemeral landscape aspects for example, noticeable smells, sounds and weather conditions (Table 1). Whilst all respondents were required to complete this, it was kept separate from the overall score of the VQI to maximise the VQIs objectivity. Whilst perceptual processes are an integral aspect of landscapes (Daniel, 2001); the inclusion of a preference survey separate to the VQI meant the relatively objective VQI score could be compared against subjective and emotional responses to the landscapes. This would enable it to be determined whether landscapes that were afforded a high visual quality score were also deemed to be more attractive (Ode et al., 2008; Ode et al., 2009).
3. Epping Forest case study
3.1 Using the VQI to promote enquiry
An adapted version of Swetnam et al.’s (2017) Welsh Visual Quality Index (VQI) was used with 250 A Level Geography students completed the VQI over a period of 2 months at FSC Epping Forest, in May and June 2018. All students had limited to no prior experience of the landscapes of Epping Forest, therefore the VQI was used as an introduction to the landscape components that could be found there. Three locations within Epping Forest were visited by participants, the Pillow Mounds, Rushy Plain and Paul’s Nursery. These were chosen as they represent two of the predominant landscapes within Epping Forest, open view grassland plains and closed view woodland. It is important to note that these three sites are not representative of the entirety of Epping Forest, with significant cultural features such as Loughton Camp and Queen Elizabeth’s Hunting Lodge; and significant blue-space features including Connaught Water.
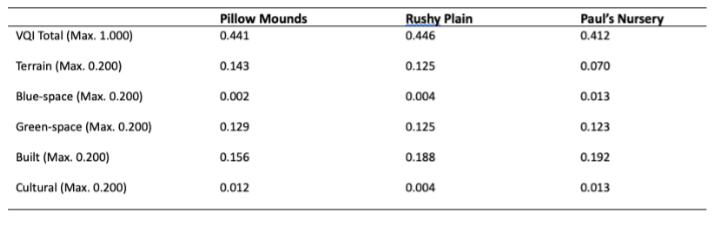
Prior to completing the VQI, students were asked what they could investigate in Epping Forest for their NEA. Responses included ‘carbon’ ‘the water cycle’ and other rather vague investigation titles. All respondents then completed the VQI using ESRI Survey123 software using the five landscape components: physical environment, blue-space, green-space, built environment and the cultural landscape, to ‘measure’ the visual quality of a landscape (Swetnam et al., 2017; Swetnam & Tweed, 2018). From this, it was possible to view in real time the characteristics of the landscapes being recognised by students. Table 2 illustrates that these landscapes were being viewed to display similar characteristics, with the most important components of the chosen landscapes being greenspace and built categories (Table 2). By contrast the least important categories were cultural and blue-space (Table 2). From this, FSC tutors were able to lead discussions as to what investigations would be suitable in this location. Responses included ‘interception in the drainage basin by different tree cover’; ‘carbon sequestration of different tree species’; ‘affect of slope on surface runoff in the hydrological cycle’. Whilst by no means official titles, it is clear that the VQI has stimulated students in looking closer at the landscape around them with an enquiry focussed eye.
3.2 Using the VQI to understand place perceptions
Table 3 highlights students’ responses to the preference survey; showing they viewed the landscapes in a positive light. Variation in responses can be explained by the fact that perceptual processes can be affected by a wider range of processes (Tudor, 2014). The results of the appeal score may be affected negatively or positively based on what has been experienced as part of the unassessed landscape; with familiarity of individuals within a group with such a landscape ultimately being one of the biggest governing factors (Kaplan & Kaplan, 1989; Brush et al., 2000). This is a concept that Castree (2003) highlights as being difficult for students to understand. Using a preference study alongside the VQI allows students to see that whilst the landscape components remain the same for everyone, their preferences will vary based on ephemeral factors such as smells, weather and sounds, alongside their familiarity and experiences with such landscapes.

3.3 Using the VQI to develop data analysis skills
A final use of the VQI has been its use with modelling data analysis skills. At a simple level, students can practice GCSE level data analysis through the presentation of graphs and mathematical skills such as Mean and Range. As illustrated in this study, when ranked by mean VQI score, the results show Rushy Plain had the highest landscape quality with a VQI of 0.446, which was then closely followed by the Pillow Mounds with a VQI of 0.441 and Paul’s Nursery with a VQI of 0.412 (Table 2). Further analysis could be conducted by students, highlighting the breakdown of the various landscape components along with the range in mean VQI responses only being 0.034. From this, conclusions can be made by some students that the landscapes have a similar visual quality.
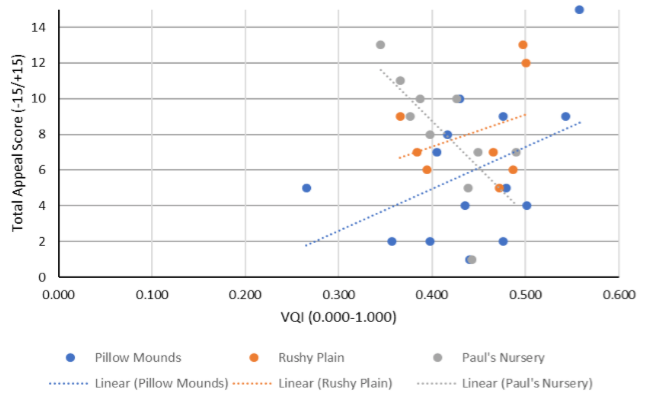
At a more advanced level, statistical tests can be conducted on the data to see if correlation are in fact significant. Whilst Figure 2 illustrates a positive correlation for VQI Score and appeal (as per Lothian, 1999; Swetnam & Tweed, 2018), in the case of Epping Forest overall this is weak given the spread of data. Furthermore, at Paul’s Nursery it was possible to identify a negative trend whereby as landscape quality increased, appeal decreased. Whilst unexpected, these tie into Kaplan and Kaplan (1989) and Brush et al. (2000) who highlight that ultimately it is familiarity with a landscape that governs appeal. Students were able to conduct a Spearman’s Rank assessment, their hypothesis being that as landscape quality increased so would appeal. The results of the Spearman’s Rank assessment revealed that there was no significant correlation between VQI score and appeal score at both the Pillow Mounds and Rushy Plain. By contrast the negative correlation at Paul’s Nursey was deemed to be statistically significant. Furthermore, for students that have a strong understanding of statistics, it would be possible to conduct further statistical tests such as ANOVA or T-tests to look for variation in means between data sets. This highlights further the VQIs usefulness at A Level, not only as a tool for investigating landscapes, but to develop all important skills for the NEA.
4. Conclusions
Having previously been trialled within both a Welsh and Icelandic setting (Swetnam et al., 2017; Swetnam & Tweed, 2018), the landscape assessment technique presented here is successful in being representative of rural places in the United Kingdom. The use of the VQI as an A Level Geography resource was one of the biggest positives in this research owing to its ability to allow students to interpret places through a critical and structured lens. Within the case study of Epping Forest, it has been illustrated how the VQI can serve a threefold purpose. It introduces students to landscapes, both familiar and unfamiliar, getting them to analyse them with a critical enquiry-based eye. It helps students to see how perceptions of places can be influenced by several factors, including both ephemeral and perceptual factors. Finally, it can be used as a hook to develop some of the all-important data analysis skills that are required of A Level Geography.
It now remains to be seen if it can be included within the exam focussed fieldwork of GCSE Geography or perhaps even at Key Stage 3 as a tool to introduce students to both familiar and unfamiliar landscapes. Any future improvements to the method itself will revolve around creating a methodology that is more suited to assessing urban landscapes, with this including the recognition of listed buildings, as well as the inclusion of street furniture and art.
5. References
Arriaza, M., Cañas-Ortega, J.F., Cañas-Madueño, J.A. and Ruiz-Aviles, P., (2004). Assessing the visual quality of rural landscapes. Landscape and urban planning, 69(1), pp.115-125.
Bernaldez, F.G., Gallardo, D. and Abello, R.P., (1987). Children’s landscape preferences: From rejection to attraction. Journal of Environmental Psychology, 7(2), pp.169-176.
Brush, R., Chenoweth, R.E. and Barman, T., (2000). Group differences in the enjoyability of driving through rural landscapes. Landscape and Urban Planning, 47(1-2), pp.39-45.
Castree, N (2003). ‘Place: connections and boundaries in an interdependent world’ in Holloway, S., Rice, S. and Valentine, G. (eds.) Key Concepts in Geography. London: Sage.
Daniel, T. (2001). Whither scenic beauty? Visual landscape quality assessment in the 21st century. Landscape and Urban Planning. 54. pp. 267-281.
Department for Education (2014a). Geography GCSE Subject Content [Online] Available from: https://www.gov.uk/government/publications/gcse-geography [Accessed 28/10/2021]
Department for Education (2014b). Geography GCE AS and A Level subject content [Online] Available from: https://www.gov.uk/government/publications/gce-as-and-A Level-geography [Accessed 28/10/2021]
Driessnack, M., (2009). Children and Nature‐Deficit Disorder. Journal for Specialists in Pediatric Nursing, 14 (1), pp.73-75.
Franck, S., Fürst, C., Koschke, L., Witt, A. & Makeschin, F. (2013). Assessment of landscape aesthetics- Validation of a landscape metrics-based assessment by visual estimation of the scenic beauty. Ecological Indicators. 32. pp. 222-231.
García-Llorente, M., Martín-López, B., Iniesta-Arandia, I., López-Santiago, C.A., Aguilera, P.A. and Montes, C., (2012). The role of multi-functionality in social preferences toward semi-arid rural landscapes: an ecosystem service approach. Environmental Science & Policy, 19, pp.136-146.
Herzog, T.R. and Bosley, P.J., (1992). Tranquillity and preference as affective qualities of natural environments. Journal of environmental psychology, 12(2), pp.115-127.
Howley, P. (2011). Landscape aesthetics: Assessing the general publics’ preferences towards rural landscapes. Ecological Economics. 72. pp. 161-169.
Kaltenborn, B.P. and Bjerke, T., (2002). Associations between environmental value orientations and landscape preferences. Landscape and urban planning, 59(1), pp.1-11.
Kaplan, S. (1988). Perception and landscape: conception and misconception. In: Nasar, J. (ed.) Environmental aesthetics Theory, Research, and Application. Cambridge: Cambridge University Press
Kaplan, R. & Kaplan, S. (1989). The Experience of Nature: A Psychological Perspective. Cambridge: Cambridge University Press.
Lothian, A. (1999). Landscape and the philosophy of aesthetics: is landscape quality inherent in the landscape or in the eye of the beholder? Landscape and Urban Planning. 44. pp. 177-198.
Lyons, E., (1983). Demographic correlates of landscape preference. Environment and behaviour. 15(4), pp.487-511.
Ode, Å., Tveit, M. & Fry, G. (2008). Capturing Landscape Visual Character Using Indicators: Touching Base with Landscape Aesthetic Theory. Landscape Research. 33 (1). pp. 89-117.
Ode, Å., Fry, G., Tveit, M., Messager, P. & Miller, D. (2009). Indicators of perceived naturalness as drivers of landscape preference. Journal of Environmental Management. 90. p. 375-383.
Palmer,J. F. & Hoffman, R. E., (2001). Rating reliability and representation validity in scenic landscape assessments. Landscape and Urban Planning. 54. pp. 149-161.
Rechtman, O., (2013). Visual perception of agricultural cultivated landscapes: key components as predictors for landscape preferences. Landscape research, 38(3), pp.273-294.
Riley, S.J., DeGloria, S.D., and Elliot, R. (1999). Index that quantifies topographic heterogeneity. Intermountain Journal of Sciences, 5(1-4), pp.23-27.
Swetnam, R.D., Smith, G.R. and Prochorskaite, A. (2015). Landscape and Historic. Chapter 4 of second year contract report by the GMEP monitoring team to the Welsh Government, Cardiff. In: contract report by the GMEP monitoring team to the Welsh Government. GMEP.
Swetnam, R.D., Harrison-Curran, S.K. and Smith, G.R., (2017). Quantifying visual landscape quality in rural Wales: A GIS-enabled method for extensive monitoring of a valued cultural ecosystem service. Ecosystem Services, 26, pp.451-464.
Swetnam, R. D., & Tweed, F. S. (2018). A tale of two landscapes: Transferring landscape quality metrics from Wales to Iceland. Land Use Policy, 76, 565-57
Tudor, C. (2014). An Approach to Landscape Character Assessment. Natural England.
Warwick, H. (2017). Linescapes. Remapping and Reconnecting Britain’s Fragmented Wildlife. Square Peg: London.
Wheeler, B.W., White, M., Stahl-Timmins, W. and Depledge, M.H., (2012). Does living by the coast improve health and wellbeing? Health & place. 18(5), pp.1198-1201.
Zube, E.H., Pitt, D.G. and Evans, G.W., (1983). A lifespan developmental study of landscape assessment. Journal of Environmental Psychology, 3(2), pp.115-128.
6. Appendix
#Write for Routes
Are you 6th form or undergraduate geographer?
Do you have work that you are proud of and want to share?
Submit your work to our expert team of peer reviewers who will help you take it to the next level.
Related articles
