
By Anna Pennington (Teacher of Geography at Pangbourne College)
Citation
Pennington, A. (2022) Examining the impact of the East Coast Low Storm, June 2016 on Narrabeen-Collaroy Beach, Sydney, Australia. Routes 2(2): 80- 90
Abstract
Large storms can move significant quantities of sand offshore, which can cause greater erosion on the beach. An Australian East Coast Low (ECL, also called an extratropical cyclone) hit the Northern Beaches area of Sydney, Australia in June 2016 at an anomalous wave direction. Using an original programming script (MATLAB) of the empirical beach profiles (n=25) taken before and after the storm shows a gain of sand volume from the northern to southern profiles possibly indicating the process of rotation. Profile 2 located in the north of the beach is estimated to have lost 38% of its pre-storm sand volume. Profiles 6 and 8 show a steepening in shape due to loss of sand causing a reduction in the beach width. The impacts from the storm highlight the increasing vulnerabilities of coastal communities to high-intensity storms which are predicted to increase in frequency with climate change.
Glossary
Embayment: the presence at their extremities of large physical barriers (i.e., headlands) trap alongshore-moving sediment. (Harley et al. 2011).
Rotation: The trapping of along-shore moving sediment can result in resulting in net erosion/accretion at the updrift/downdrift ends of the beach. A shift in the direction of the wave approach can subsequently reverse this process (Harley et al. 2011).
1. Introduction
Beaches represent a dynamic interface between the coastline and the ocean. At an embayed beach the influences of the rocky headlands lead to excess sand found towards one outcrop of rocks which is a reflection of the modal wave climate. Narrabeen-Collaroy, Sydney, New South Wales, is exposed to East Coast Lows (ECL), for example in 2007 and 2015 (Harley et al. 2016) which cause significant coastal erosion. Further understanding of them allows for predictions to be made about the response to these storms by the beach (Harley et al. 2016) and this research aims to contribute to that through an analysis of a single case study of an east coast low in June 2016. The specific aims of the research are now set out.
Aims
- To analyse the impact of the June 2016 ECL upon the shape of the beach profiles using empirical data from a long-term open-access database on MATLAB and to determine if the beach underwent rotation
- To explore the implications of increased frequency of anomalous storms on the existing coastal management of the Narrabeen- Collaroy beach.
2. Study site
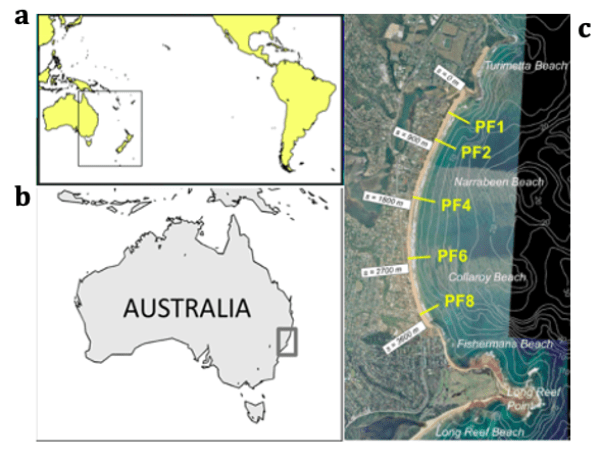
Narrabeen-Collaroy is a 3.5km long beach north of Sydney, Australia (see Figure 1b) and is classified as an embayed beach and has two impermeable boundaries of Narrabeen-Collaroy head to the north and Long reef point to the South (see Figure 1c) (Short and Trembanis 2004). The beach has been surveyed at the locations marked in Figure 1c at least monthly since 1976 (Harley et al. 2017). The beach is orientated to a wave angle of 135º SE (Harley et al. 2017) which composes 70% of the wave observations (Mortlock et al. 2017)
The population density on Narrabeen-Collaroy has increased in recent years and the most densely populated area is the southern end of the beach with over 377 properties with an average value of AUD $633,000 per address (Northern Beaches Council 2016).
Firstly, this report will outline the storm and the nature of Narrabeen- Collaroy and the methodology was undertaken to investigate impacts from the 2016 ECL using programming data from MATLAB. By describing the results, the impact of the storm from beach profile plots is explored, finally in the discussion, the possibility that the beach underwent rotation is explored.
3. East Coast Lows (ECL)
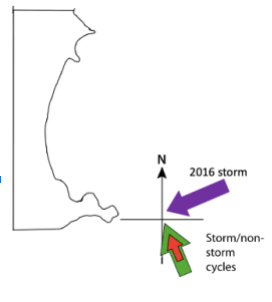
An ECL is a regular feature of the Australian autumn to wintertime and characterised by – strong winds, heavy rain and powerful wave conditions on the South- Eastern Coast (Mortlock et al. 2017). In June 2016 an ECL developed off the East Australian coast and impacted over 2000km of coastline and the timing coincided with the Spring King tides of the year (ibid).
The 2016 ECL was not the first significant storm to impact Narrabeen-Collaroy. Two previous ECL events have occurred in 2007 and 2015. These events caused significant erosion causing the beach to rotate wherein the sand was transported from the Northern to Southern end of the beach there was a reduction in the quantity of sand from 78m3 per alongshore metre and in 2015 a reduction of 54m3 per alongshore metre (Harley et al. 2016).
Embayed beaches
An embayed beach implies some degree of curvature (da Fontoura Klein et al. 2002) to the beach planform (Harley et al. 2015) and the presence of one or two artificial impermeable boundaries which constrains the movement of the sediment enclosed in them (ibid).
Within an embayed beach there is described a disequilibrium of sediment (Harley et al. 2011) which can lead to the process of rotation which is associated with the dominant wave direction of the beach (Castelle and Coco 2012). Beach rotation is a process which is associated with a response to wave direction (ibid) (Harley et al. 2015) and can form rip currents that move the sediment offshore (Mortlock et al. 2017) in the alongshore and the across-shore directions from the two extremities of the beach (da Fontoura Klein et al. 2002).
4. Methodology
Narrabeen-Collaroy has been monitored by monthly beach profiles since 1976 (Short and Trembanis 2004) initially completed using the Emery method (Emery 1961) but since 2004 to be RTK- GPS (Real-Time Kinematic Global positioning system). The data of the height and elevation (taken from 0 Australian Height Datum – AHD) is stored in an open-source database (http://narrabeen.wrl.unsw.edu.au/download/narrabeen/) run by the University of New South Wales (Turner et al. 2016). The beach profile data from the dates surrounding the storm cross-referenced to (Mortlock et al. 2017) the 03/06-14/06/2016. The 18/05/16 was the last data point before the storm occurred and was taken as a comparison of the beach planform before the storm. Using the MATLAB script based on (Gallop et al. 2017) allowed repeated searches of the database to generate graphs with titles and axis labels (Appendix 1.2). To estimate the volume change in the sand on the profile by summing the heights of the sand elevations from the AHD and dividing by distance along the beach (Appendix 1.3).
3. Results
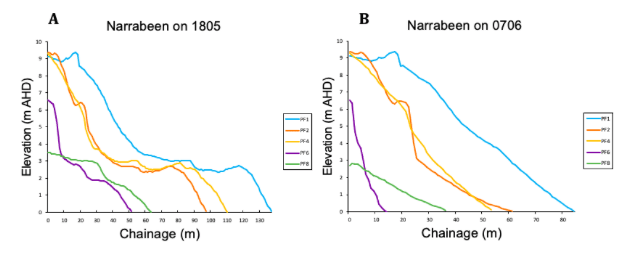
In Figure 3a the beach profiles on 18/05 shows the localised gradient of wave exposure reflected in the extent of the beach profiles casting a shadow from the North to the South (Jackson and Cooper 2009). The influence of the headland causes longer profiles in Narrabeen-Collaroy compared to the South (Figure 1c) which demonstrating the impact of Figure 2.

Figure 4; A- shows that Profile 1 reduced the overall extent of extent by 20m and a reduction in volume. B – of Profile 2 shows a greater amount of narrowing from 100m on the 3rd to 59m on the 6th . C- Profile 4 was shortened by 40m in the storm due to the non- modal wave angle. D- The shortening increases as you go further south and Profile 6 lost 75% in sub-aerial beach volume and a 40m reduction in the extent. E- profile 8 shows a 56% reduction in the extent from 18/06/16 to 07/06/16. The reduction in the buffer of the sand to the coastline affects the coastal erosion experienced.
4. Discussion
The headlands of Narrabeen- Collaroy (Figure 1c) create a localised gradient of wave exposure (Harley et al. 2017) with sand orientated to the wave angle (Daley et al. 2011) and a buffer created to the dominant storm direction (Mortlock et al. 2017). The wave angle orientation of the beach seen Figure 1a where the profiles have a greater extent in the North compared to the South. Pre-storm the Southern profiles are narrower and create a reduced ability of the sand to form a natural buffer in a non-modal wave direction. The beach profiles plotted in Figure 4 show that the storm non-modal direction did not create an expected rotation of the beach (Castelle and Coco 2012; da Fontoura Klein et al. 2002), where an excess of sand would be now found in Southern profiles at Narrabeen-Collaroy (Harley et al. 2011). The rotation in the embayment did not fully occur from the North to the Southern due to the development of a rip current, an efficient mechanism for the offshore transport of sediment (Holman et al. 2006) in moderate to high wave conditions (Short 1985). This is seen in the literature where embayed beaches have been associated with severe erosion developing from the strong rips that develop in the beach morphology (Louriero et al 2012).
The rip current was modelled to have formed by Mortlock et al. (2017) from due to the collision of the littoral cell with Long Reef point from increased wave energy changing the beach state (Wright and Short 1985;Harley et al. 2016). An increase in the beach state in the southern end from being reflective to being in a state where unidirectional rip currents form (Wright and Short 1985). The higher energy state is not common for the southern profiles (Harley et al. 2016) and creates beach profiles which have steeper faces (Wright and Short 1985). The beach profiles were plotted using a software which is designed for mathematical purposes and did not produce errors from the script. The greatest source of systematic error is the calculation of the sub-aerial volume of the profile from underlying assumptions within the calculation that there is linearity between each of the survey points (Cooper et al. 2000). The collection of the beach profiles during storm events is limited by the importance of safety in the undertaking of the surveying (Turner et al. 2016).
Beach management
The 377 beach front properties with an average value of AUD $633,000 per address (Northern Beaches Council 2016) which are vulnerable to the wave conditions due to their constructions on a pre-existing NSW coastal erosion hot-spot (Mortlock et al. 2017). The ECL demonstrates the lack of preparation to the increased frequency of the wave climate rotating and the current sea wall was undermined (Gordon et al. 2016) and the sand in front of the existing works in the Southern section of Narrabeen-Collaroy had been removed (Morrison et al. 2016). Additionally, the headlands caused the loss of the sand most acutely in the southern regions whereby the 7th of June over 1km of sea walls had suffered damage ranging from toe flanking to wall collapse (Gordon et al. 2016).
The updated Coastal Zone Management for the area does not consider the possibility of an increased frequency of the wave climate rotating (Mortlock et al. 2017). There are anticipated changes over a longer time scale where projections indicate an anti-clockwise rotation in the mean wave direction for the South-West Pacific region (ibid) in the direction and increasing height of waves; this is a signature of climate change (Mortlock et al. 2017).
The future for protection works against ECLs to use beach nourishment to protect the properties along the shoreline with careful timing (Northern Beach councils 2016). The timing of the placement is to be as close to a storm to minimise the disruption to the normal northward transport of sediment within the beach. This will allow the properties to be protected and the sediment quantity increase within the embayment to form part of a long-term coastal protection programme.
5. Conclusions
The ECL experienced on Narrabeen-Collaroy demonstrates the vulnerability of the Southern end of Narrabeen-Collaroy to erosion from a non-modal wave angle. This significantly affected properties in the region near profiles 6 and 8 which lost their extent and ability to buffer erosion. The non-modal wave angle caused a partial rotation of the sediment Southwards but lacked a full rotation due to the formation of a rip current from the Long Reef head which transported the sediment offshore. The damage caused to Southerly properties along Narrabeen-Collaroy raises further questions about the effectiveness of the beach management strategy employed by the Northern Beaches council to East Coast Lows, which are predicted to increase in frequency with climate change (Mortlock et al. 2016). The study additionally has shown the abilities in an original MATLAB code of a large data set to produce graphical beach profiles and further deepens the techniques used in coastal geomorphology of MATLAB in analysis.
6. References
Castelle, B. and Coco, G., 2012. The morphodynamics of rip channels on embayed beaches. Continental Shelf Research, 43, pp.10-23.
Cooper, N.J., Leggett, D.J. and Lowe, J.P., 2000. Beach-Profile Measurement, Theory and Analysis: Practical Guidance and Applied Case Studies. Water and Environment Journal, 14(2), pp.79-88.
Daly, C.J., Bryan, K.R., Roelvink, J.A., Klein, A.H.F., Hebbeln, D. and Winter, C., 2011. Morphodynamics of embayed beaches: the effect of wave conditions. Journal of Coastal Research, (64), p.1003
Da Fontoura Klein, A., Fliho L.B., Schumacher, D., 2002. Short Term Beach Rotation Processes in Distinct Headland Bay Beach Systems. Journal of Coastal Research , pp 442-458.
Emery, K.O., 1961. A simple method of measuring beach profiles. Limnology and oceanography, 6(1), pp.90-93.
Gallop, S.L., Harley, M.D., Brander, R.W., Simmons, J.A., Splinter, K.D. and Turner, I.L., 2017. Assessing cross-shore and alongshore variation in beach morphology due to wave climate: Storms to decades. Oceanography, 30(3), pp.120-125.
Gordon, A., Britton G, Dickenson, T. Collaroy Beach, 2016. D Day Storm – Lessons learnt, In proceedings of the NSW Coastal Conference, Coffs Harbour, Australia, 9-11 November 2016
Harley, M.D., Turner, I.L., Kinsela, M.A., Middleton, J.H., Mumford, P.J., Splinter, K.D., Phillips, M.S., Simmons, J.A., Hanslow, D.J. and Short, A.D., 2017. Extreme coastal erosion enhanced by anomalous extratropical storm wave direction. Scientific reports, 7(1), pp.1-9.
Harley, M.D, Turner, L, Splinter, K, Phillips, M, Simmons, 2016. Beach response to Australian East Coast Lows: A comparison between the 2007 and 2015 events, Narrabeen-Collaroy- Collaroy Beach. Journal of Coastal Research 75, 388-392.
Harley, M.D., Turner, I.L. and Short, A.D., 2015. New insights into embayed beach rotation: The importance of wave exposure and cross-shore processes. Journal of Geophysical Research: Earth Surface, 120(8), pp.1470-1484.
Harley, M.D., Turner, I.L., Short, A.D. and Ranasinghe, R., 2011. A reevaluation of coastal embayment rotation: The dominance of cross‐shore versus alongshore sediment transport processes, Collaroy‐Narrabeen-Collaroy Beach, southeast Australia. Journal of Geophysical Research: Earth Surface, 116(F4).
Holman, R.A., Symonds, G., Thornton, E.B. and Ranasinghe, R., 2006. Rip spacing and persistence on an embayed beach. Journal of Geophysical Research: Oceans, 111(C1).
Jackson, D.W.T. and Cooper, J.A.G., 2009. Geological control on beach form: accommodation space and contemporary dynamics. Journal of Coastal Research, pp.69- 72.
Loureiro, C., Ferreira, Ó. and Cooper, J.A.G., 2012. Extreme erosion on high-energy embayed beaches: influence of megarips and storm grouping. Geomorphology, 139, pp.155-171.
Northern Beaches Council, 2016. Coastal Zone Management Plan for Collaroy- Narrabeen-Collaroy Beach and Fishermans Beach Available at https://files.northernbeaches.nsw.gov.au/sites/default/files/finalczmpfor_collaroy-Narrabeen-Collaroybeachandfishermansbeach2016.pdf (Accessed 27/03/2021)
Manly Hydraulics Laboratory, 2016. http://new.mhl.nsw.gov.au/
Mortlock.T, Goodwin. Roche, K., 2016. Coastal Impacts of the June 2016 Storm for Sydney . Available at: https://riskfrontiers.com/rf2018/wp-content/uploads/2016/11/Briefing_Note_319_coastal-erosion_June-storm.pdf
Mortlock, T.R., Goodwin, I.D., McAneney, J.K. and Roche, K., 2017. The June 2016 Australian East Coast Low: Importance of Wave Direction for Coastal Erosion Assessment. Water, 9(2), p.121.
Morrison ,C., Macdonald,T., Dickenson,T., The long and short of responding to East Coast Lows : Actions and policy respone from two coastal erosion hotspots In Procedings of the NSW Coastal Conference, Coffs Harbour, Australia, 9-11th November 2016
Short, A.D. and Trembanis, A.C., 2004. Decadal scale patterns in beach oscillation and rotation Narrabeen-Collaroy Beach, Australia—time series, PCA and wavelet analysis. Journal of Coastal Research, pp.523-532.
Short, A.D., 1985. Rip-current type, spacing and persistence, Narrabeen-Collaroy Beach, Australia. Marine Geology, 65(1-2), pp.47-71.
Turner, I.L., Harley, M.D., Short, A.D., Simmons, J.A., Bracs, M.A., Phillips, M.S. and Splinter, K.D., 2016. A multi-decade dataset of monthly beach profile surveys and inshore wave forcing at Narrabeen, Australia. Scientific data, 3(1), pp.1-13.
Wright, L.D., Short, A.D. and Green, M.O., 1985. Short-term changes in the morphodynamic states of beaches and surf zones: an empirical predictive model. Marine Geology, 62(3-4), pp.339-364.
7. Appendix
Appendix 1.1 Script to trim the data set and download data set from my hard drive
- 1 formatSpec = ‘%s%C%{dd/MM/yyyy}D%f%f%s’;
- 2 T = readtable(‘EDIT_profiles .csv’,’Delimiter’,’,’,’Format’,formatSpec);
- 3 T = T(:,2:5);
First line is the definition of the function in Matlab code telling the
Finds through the data set to returned a 1 when the specific profile and date are correct.
Appendix 1.2 Script to create function to use for plotting the graphs
function PlotData = FindData(profile,date,T) correctProfile = profile == T{:,1};
date = datetime(date,’InputFormat’,’dd/MM/yyyy’); correctDate = date == T{:,2};
PlotData = []; l = size(T,1); for i = 1:l
if correctDate(i) && correctProfile(i) && T{i,4}>0 PlotData = cat(1,PlotData,T{i,3:4});
end end
After knowing where the correct profiles are this step is the removal of this from the data set into a specific table containing the matching profile and date that is desired.
Appendix 1.3 Heatmap graphic of the volumes of the beach profiles
profiles = {‘PF1′,’PF2′,’PF4′,’PF6′,’PF8’};
dates = {’07/01/2016′,’15/04/2016′,’29/04/2016′,’18/05/2016′,’03/06/2016′};
HeatMapx = zeros(5,5); for i = 1:5
for j = 1:5
DataBeach = FindData(profiles{i},dates{j},T); Volume = sum(DataBeach(:,2)); HeatMapx(i,j) = Volume;
end end
xvalues={’07/01/2016′,’15/04/2016′,’29/04/2016′,’18/05/2016′,’03/06/2016′}; yvalues={‘PF1′,’PF2′,’PF4′,’PF6′,’PF8’};
heatmap(xvalues,yvalues,HeatMapx)
Starting off with the specifying of the profiles and the dates,
- – Heatmap declared as the item that is going to be undertaken
- – Create an array of 0 in the size specified by the brackets
- – I is the y axis
- – J is the x axis
- – Dates are the columns which increase dates so RH no
- – Profiles are rows
- – The volume is calculated from the addition of the different heights in the profile.
- – The heat map is then coloured in by the volume as the colour gradient.
#Write for Routes
Are you 6th form or undergraduate geographer?
Do you have work that you are proud of and want to share?
Submit your work to our expert team of peer reviewers who will help you take it to the next level.
Related articles
