
By Dylan Gussman, University of Exeter
Citation
Gussman, D. (2021) Modelling the Potential Impacts of Climate Change on River Morphology. Routes 2(1): 39-47
Abstract
River morphology studies are necessary to understand rivers in a changing world. With the threat of climate change ever increasing, instability in riverine systems may lead to the loss of property and life. Models can be used to predict changes in these systems under certain conditions. In this report, a 1D model has been used to investigate changes to riverbed elevation across the length of a river under different scenarios. A sensitivity analysis has been carried out by changing parameters of the model. Discharge and sediment load have the largest effect on rivers and counterbalance one another when at certain levels. These findings have implications for river management to prevent the loss of property and life in the future.
1. Introduction
It is predicted that precipitation patterns will increase in frequency and intensity over the next century (IPCC, 2014). This will exaggerate the rate of change in river systems, which are already highly dynamic as it is. Increased precipitation results in raised discharge levels in the river channel and more runoff from land causing fluxes of sediment into the river system to rise (Smithson et al., 2008). River channels adjust their channel pattern and slope in response to external pressures as a form of dynamic equilibrium. There is a need to recognise the potential effects that climate change will have on river systems globally. Only a small number of rivers have gauging stations to monitor sediment load and discharge throughout their basins so numerical models are an alternative to study rivers (Kettner et al., 2010). In this study, changes will be modelled to show the effect climate change will have on riverbed elevation and the potential impacts for communities living alongside them.
2. Method
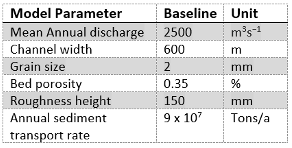
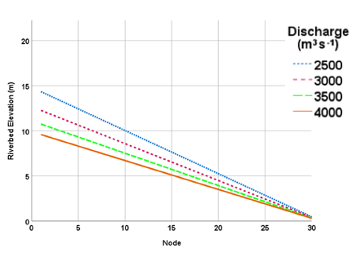
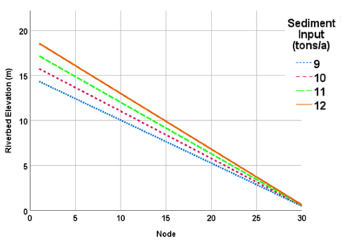
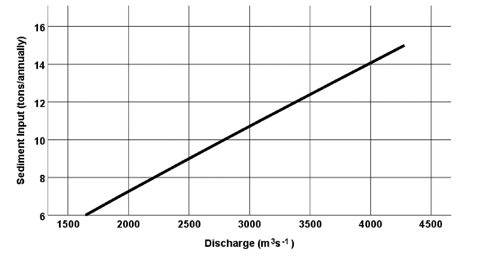
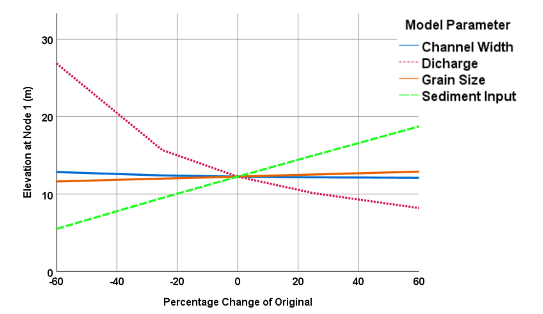
The model, created by Dr Gary Parker (Parker, 2006), shows the riverbed elevation over a 10km stretch of river which have similar characteristics to the Rhine. Riverbed elevation was chosen since it has influences on several riverine processes. This has been divided into 30 nodes so that elevation measurements could be taken, and relevant equations can be solved; nodes were equally spread over the river’s length. Node 1 is at the source of the river whilst Node 30 is at the mouth. Initial model parameters are shown in Table 1. The adaptability of the model allows many scenarios to be investigated relatively easily. It can be used to model real rivers by inputting measured values or exploring hypothetical situations where data can be altered to suit the requirements of the study. To investigate how climate change would affect similar rivers the model was run several times, changing single parameters each time to be able to visualise the difference in the results. Discharge and sediment input parameters were focused on initially, as an increase in precipitation will cause both of these to alter in the future. Other model parameters remained the same for comparability in Figures 1 and 2. The dynamic equilibrium of the river system was explored by testing what discharge was required to maintain the same riverbed elevation at different sediment inputs (Figure 3). 1D models are useful as they can be adapted to suit different real examples that would be more complicated to carry out in more sophisticated models; this has been proven by the Parker Models’ versatility. A sensitivity analysis (Figure 4) has been carried out to assess individual parameters’ effects on riverbed elevation. For this, the baseline values were changed by 25% and 60% to enable an overview of their influence on river systems.
3. Results
In the first series of model runs, discharge was increased to evaluate its influence on bed elevation. Figure 1 shows that as the discharge increases the bed elevation decreases. The largest elevation change can be seen at source of the river, with no change at the mouth of the river. This is because the model fixes the endpoint of the river at Node 30 and hinges the riverbed profile onto this. In reality, this occurs due to sea level being the controlling factor for river base height. Node 1 is 5.49 metres lower when the discharge is 5,000 m3s−1 compared to when it is 2,500 m3s−1. Figure 2 shows that the riverbed elevation increases as the sediment input increases. Sediment has been increased linearly and the increase at Node 1 has been the same. There is also a linear relationship with the sediment input and discharge to maintain the bed elevation equilibrium as shown in Figure 3. Sediment was initially increased in this series of model runs and then discharge was slowly increased until it reached the same elevation as the initial no-change scenario. The sensitivity analysis (Figure 4) shows that discharge has the biggest effect on Node 1 elevation when it is decreased; between -20% and -60% there is a rapid change in the rate of elevation rise. This could be due to the fact that the system is completely unbalanced and is unfamiliar to such high discharge. Both channel width and grain size have negligible change across the entire spectrum of values that were tested. Sediment input has a similar impact irrespective of it being increased or decreased.
4. Discussion
Future climate change is projected to cause precipitation rates to increase, and this will lead to higher discharge in rivers. This causes the riverbed elevation to decrease as there is more erosion on the bed (Figure 1). Erosion occurs due to the critical shields number of the bed being met by the increased discharge. As output is greater than input in this morphological system, bed elevation decreases until a new equilibrium can be met. However, these increased precipitation rates will lead to more surface run off and soil erosion (Smithson et al., 2008) and consequently results in more sediment being input into the river annually. As shown in Figure 2, this leads to the bed elevation rising along the river profile. The effects of this may be exacerbated by deforestation, agricultural practices, and land use change (Restrepo and Syvitski, 2006) which will increase the mobility of sediment. Due to the fact that this is a simulated river and not real-world measurements, these can only be described as potential impacts. The model’s sediment load parameter is fed from upstream, but in a changing environment this might not be the case in the long-term. Soil erosion could potentially happen along the entire length of the river banks, and whilst sediment will still be coming from upstream, more may come from the banks of the river and alter the way that the channel responds.
Although these two processes are key to understanding how climate change will influence rivers, they are not exclusive. River width will increase due to higher bank erosion rates (Monirul et al., 2017). This can change how the previous two parameters will transpire. With a wider river, the flow will be lower so the bed incision will be slower. This could potentially cause either the bed elevation to rise or it to fall but at a reduced rate. The effect of changing the river width can be seen in Figure 4. Sea level is also expected to rise in the next century (IPCC, 2014). Whilst in the model the bed elevation is hinged at the downstream end, sea level will not have this effect. Sea level sets the base level for which the bed level is at, and thus a rise in sea level will result in an increase in bed level of the whole system, and unpredictable consequences for other parameters. This can be seen as a limitation of the model.
The findings from this study are crucial to helping us understand rivers’ response to climate change in the future. The two most likely consequences from climate change that will influence this model are higher rates of surface runoff and increased river discharge fed by more precipitation (Smithson et al., 2015). Kummu et al. (2011) found that the average population density alongside large rivers can be up to 90 people/km2 , with small rivers having 45 people/km2 on average. Therefore, changes to the morphological state of rivers can have catastrophic impacts on communities along the banks of these rivers. With a higher velocity, there will be intensified bank erosion which could lead to the destruction of properties and the loss of life. Sinuosity is influenced by the river gradient; the river aims to maintain equilibrium due to a higher velocity on steeper slopes (Kleinhans and van den Berg, 2011). An increase in soil erosion from surrounding land may cause the river bed elevation to grow, leading to increased discharge. Drought is also a potential impact of climate change that will have repercussions on riverbed elevation as it leads to lower discharge levels. Lower discharge levels whilst sediment load remains the same, will have similar results to Figure 1, where the riverbed slope becomes steeper at lower discharge levels.
There is some uncertainty in how climate change will influence these river systems. If precipitation has a larger effect on discharge than it does on surface runoff, then rivers will alter their systems. Alternatively, if both these processes occur at equal rates then rivers will be able to maintain their state of equilibrium as shown by Figure 3. Rivers are self-regulating systems and are in a state of dynamic equilibrium. It is also important to note that over the next century, average discharge and peak discharge will not increase at the same rate (Alfieri et al., 2015) and this causes even more unpredictability into how climate change may influence river morphology. Dynamic equilibrium allows rivers to restructure themselves after a perturbation in the system. Whilst an initial external factor such as an increase in sediment input may cause the channel bed to rise, this will cause a steeper slope. River velocity will increase from this action and lead to more erosion. Therefore, whilst climate change may have serious consequences to longitudinal river profiles, we may find that they correct themselves in the future.
Whilst the Parker model was chosen due to its functionality in understanding changes in bed elevation, it does have several limitations. Due to the model only being 1D rather than 2D it does not take into account the spatial channel pattern. River pattens such as meandering, braided, and straight rivers form a continuum without physical thresholds (Kleinhans and van den Berg, 2011); changes to riverbed elevation may occur differently under different river pattern conditions. The sinuosity of the river could have an impact on the riverbed elevation due to changing velocity; this has not been taken into account. Future studies where this 1D model can be converted into a 2D model to get a further understanding of the spatial variability within the riverbed elevation are required. Equally, because this is a model rather than in-situ measurements, all of the future predictions of societal impacts are potential and we cannot be completely certain in our outputs.
5. Conclusions
Climate change will certainly have an impact on fluvial systems in the future, yet it is hard to suggest exactly what these will be. The individual factors of discharge and sediment input are known to change riverbed elevation but the synergy between them is hard to calculate. As more data is produced over time, and our understanding improves, so will our models. Our results show that rivers are self-regulating systems but only if the inputs to the system increase at similar rates. They also suggest that if one of these grows faster than others, then riverbed elevation will have to adapt to maintain equilibrium. These can be used to predict future river changes and monitor one of our most important resources: water. Future studies should validate our model outputs by monitoring sediment inputs and discharge of rivers and assessing the actual change in riverbed elevation. To save the lives of countless individuals living alongside rivers, action needs to be taken to protect lives and prevent property from becoming damaged by changes to river patterns.
6. Acknowledgements
Thanks to Becca Jones for proof reading
7. References
Alfieri, L., Burek, P., Feyen, L. and Forzieri, G. (2015) Global warming increases the frequency of river floods in Europe. Hydrology and Earth System Sciences, 19(5), pp.2247-2260.
IPCC, 2014: Climate Change (2014) Synthesis Report. Contribution of Working Groups I, II and III to the Fifth Assessment Report of the Intergovernmental Panel on Climate Change [Core Writing Team, R.K. Pachauri, and L.A. Meyer (eds.)]. IPCC, Geneva, Switzerland, p151
Kettner, A.J., Restrepo, J.D. and Syvitski, J.P.M. (2010) A spatial simulation experiment to replicate fluvial sediment fluxes within the Magdalena River Basin, Colombia. The Journal of Geology, 118(4), pp.363-379.
Kleinhans, M.G. and van den Berg, J.H. (2011). River channel and bar patterns explained and predicted by an empirical and a physics‐based method. Earth Surface Processes and Landforms, 36(6), pp.721-738.
Kummu, M., De Moel, H., Ward, P.J. and Varis, O. (2011) How close do we live to water? A global analysis of population distance to freshwater bodies. PloS one, 6(6), p.e20578.
Monirul Alam, G., Alam, K., Mushtaq, S. and Clarke, M. (2017) Vulnerability to climatic change in riparian char and river-bank households in Bangladesh: Implication for policy, livelihoods, and social development. Ecological Indicators, 72, pp.23-32.
Parker, G. (2006) 1D Sediment Transport Morphodynamics With Applications To Rivers And Turbidity Currents. [ebook] Available at: <http://hydrolab.illinois.edu/people/parkerg/morphodynamics_e-book.htm?q=people/parkerg/morphodynamics_e-book.htm> [Accessed 6 November 2020].
Restrepo, J. and Syvitski, J. (2006) Assessing the Effect of Natural Controls and Land Use Change on Sediment Yield in a Major Andean River: The Magdalena Drainage Basin, Colombia. AMBIO: A Journal of the Human Environment, 35(2), pp.65-74.
Smithson, P., Addison, K. and Atkinson, K. (2008) Fundamentals Of The Physical Environment. Taylor & Francis Ltd, pp.706-708.
#Write for Routes
Are you 6th form or undergraduate geographer?
Do you have work that you are proud of and want to share?
Submit your work to our expert team of peer reviewers who will help you take it to the next level.
Related articles
