
By Mollie Cross, Timothy Lane, Celine Germond-Duret, Liverpool John Moores University
Citation
Cross, M., Lane, T., and Germond-Duret, C. (2020) World War ‘V’: Emissions change if Birmingham became vegetarian and contemporary attitudes towards vegetarianism. Routes 1(2): 198-225.
Abstract
This study uses quantitative analysis to assess the current dietary habits of 27 vegetarian and 144 non-vegetarian Birmingham residents. Results suggest that environmental reasons are a more popular motivating factor for becoming vegetarian than in previous studies. Using published nutrition and emissions data, the impact of all residents of Birmingham eating only vegetarian meals, both at-home and when dining in Birmingham restaurants, was assessed. These data show that the average Birmingham resident can save approximately 906 kg of carbon dioxide a year by only eating vegetarian meals totalling 3,924,920,776 KgCO2e (equal to 0.85% of the UK’s emissions output). However, the results indicate that city-wide vegetarianism is not currently feasible for the Birmingham population as some residents do not deem any factors as sufficient motivation.
1. Introduction
England is one of eight countries to have declared a climate emergency, owing to overwhelming evidence of rapid anthropologically-caused climate change, including a 70% global increase of greenhouse gas emissions over the last forty years (Hallstrom et al., 2014).
Subsequent increased public demand for sustainability has led to research improvements including, transport (hybrid/electric cars, use of public transport and carpooling systems), recycling accessibility (Ivanova et al., 2020) and smart meters within homes to monitor and reduce electricity and water consumption (Kelly, 2012).
Reducing individual environmental footprints is frequently researched through diet alteration, often involving reduction of animal products (Aleksandrowicz et al., 2016). Meat production uses high levels of fossil fuels, land and water consumption, animal effluence and methane release. Public association of ‘green’ and sustainable is therefore connected with ‘meat-free’ (Chandrasekar, 2019; Freeman, 2011)
High-meat consumption has been linked to obesity, diabetes and cancers (Raphaely and Marinova, 2013; Flynn and Schiff, 2017; Hallstrom, 2014), however affluent Western culture encourages meat intake beyond ‘healthy’ levels (Raphaely and Marinova, 2013; Helenius, 2009). Currently, 2 out of 3 Britons opt for a meat-favourable diet (The Vegan Society, 2019). This majority, coupled with increasing population and disposable income allowing for more out-of-home dining, increases emissions released from animal husbandry (Pohjolainen et al., 2016; Scarborough, 2014; Poore and Nemecek, 2019. Agriculture is responsible for 20% of the UK’s greenhouse gas emissions (Scarborough, 2014) and 25-30% of global greenhouse gas emissions (Bacon, 2018; Aleksandrowicz et al., 2016; Poore and Nemecek, 2019).
This report aims to (1) understand current dietary habits of Birmingham residents, and (2) calculate the average emissions reduction if every meal eaten by a Birmingham resident, both at home and at a Birmingham food establishment, was vegetarian. Birmingham was chosen as it is the UK’s second largest city behind London, which already has a prevalent vegetarian community (PETA, n.d.).
2. Methods
To evaluate the current dietary habits of Birmingham residents, two questionnaires (one for vegetarians/vegans (V), one for non-vegetarians (NV)) were distributed using ‘snowballing’ recruitment via social media and emails. In the four-week period the questionnaire links were active, 144 NV (102 females, 42 males) and 27 V (24 females, 3 males) responded (December, 2019). Respondents were anonymous and answered both open and closed ended questions to reduce response bias. A statistical t-test was conducted on open-ended answers for further analysis at a significance level of 95% and respecting the following criteria in order to reject the null hypothesis:
Critical two tale value < T stat < – Critical two tale value
Results and analysis were generalised to Birmingham’s population, however having such a small study sample reduces the validity of the generalised assumptions.
Emissions data was calculated using a standard 170 g protein per restaurant meal (Scarborough, 2014) and 75.3 g protein per at-home meal; dividing the national daily protein average of 226 g by three (Viva!Health, n.d.). Vegetarian protein value uses mean emissions of eggs, soybeans and pulses.
Restaurant data was collected from the Mailbox Birmingham, Grand Central station, the Bullring and restaurants in the suburb of Sutton Coldfield. The overall suburb value used restaurant numbers from Sutton Coldfield multiplied by 37, allowing for easier analysis but reducing the accuracy. Main protein sources were categorised, normalised for the annual frequency the population dines outside the home, and scaled to Birmingham’s population (4,332,629; worldpopulationreview.co.uk, 2019), using the UK average for 3% of vegetarians. Used in accordance with the restaurant emissions data, the output was calculated for non-vegetarian meals, vegetarian meals and the overall total for the emissions created when a Birmingham resident dines at a Birmingham establishment. The potential emissions reduction if the same number of all vegetarian meals sold was then calculated.
The ‘at-home’ meals were calculated assuming Birmingham’s population eats three meals a day minus the number of meals eaten outside the home. Questionnaire data was used to calculate how many non-vegetarian meals were eaten at home, again generalising the respondents’ answers to the wider Birmingham population. Data from the 2017/18 family food survey data (Food Standards Agency, 2018) was used to calculate the weekly grams of each animal protein bought per person. The emissions data was used to calculate total, vegetarian and non-vegetarian outputs and the subsequent overall emissions change if all meals became vegetarian.
It is important to note this method does not take into account other factors such as the other components of the meals, people visiting from outside of Birmingham and eating at these establishments and the actual numbers concerning vegetarian and non-vegetarian meals. However, allowing such generalised terms allows for a larger area to be studied (the metropolitan city of Birmingham) and is useful in terms of creating an informed estimation of the figures that can be used for further study.
3. Results
3.1 Non-vegetarian questionnaire
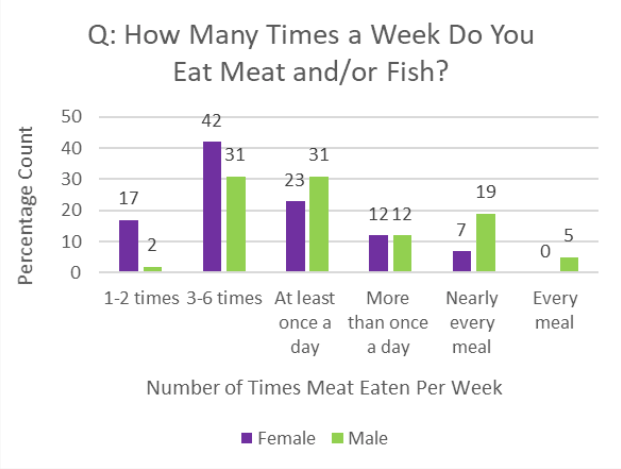
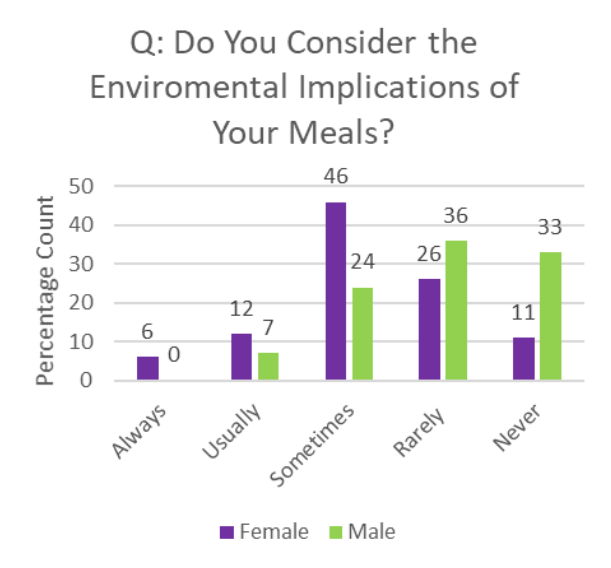
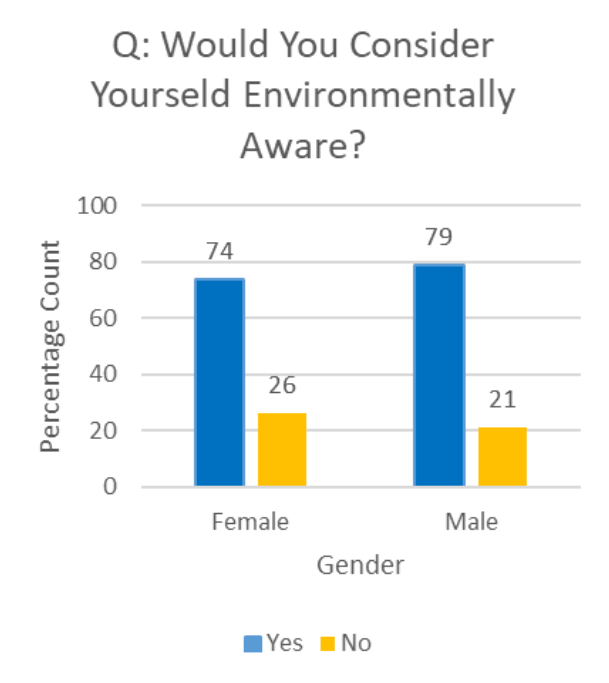


On average, men eat more meat than women daily (Fig. 1), whilst women are also more likely to order a non-fish/meat-based meal when dining outside of the home (Fig. 5). Men think themselves more environmentally aware (79%) compared to women (74%), however women are more likely to be conscious about the environmental implications of their meals (Fig. 3).
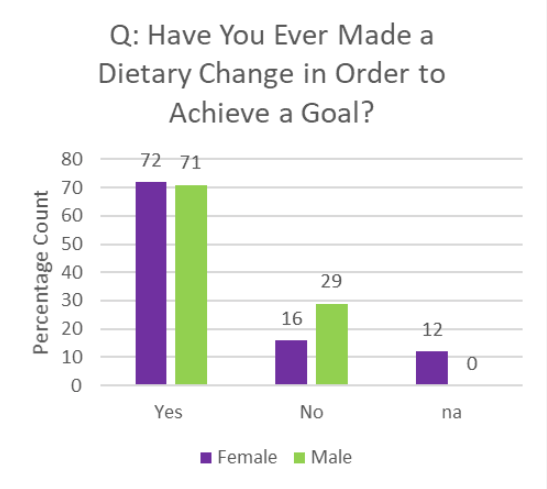
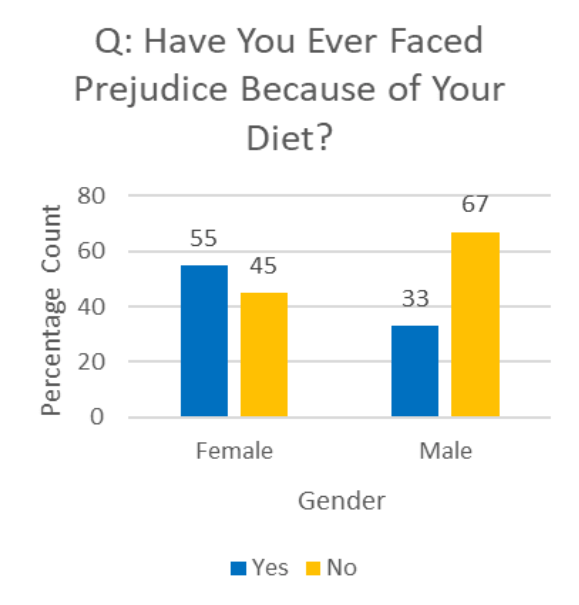
Similar numbers of both genders (72% men, 71% women) admitted to changing their diet previously to achieve a goal (Fig 2.) The majority of respondents said they did not feel as though they had faced prejudice for their dietary choices (Fig. 6). However, of those who had, more were men.
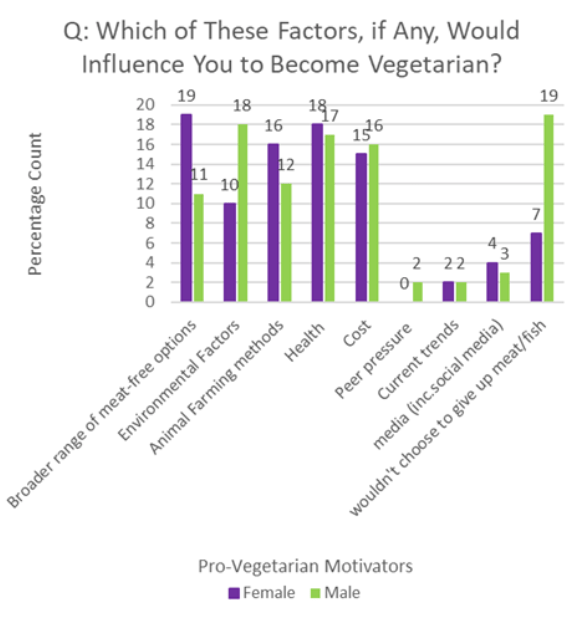
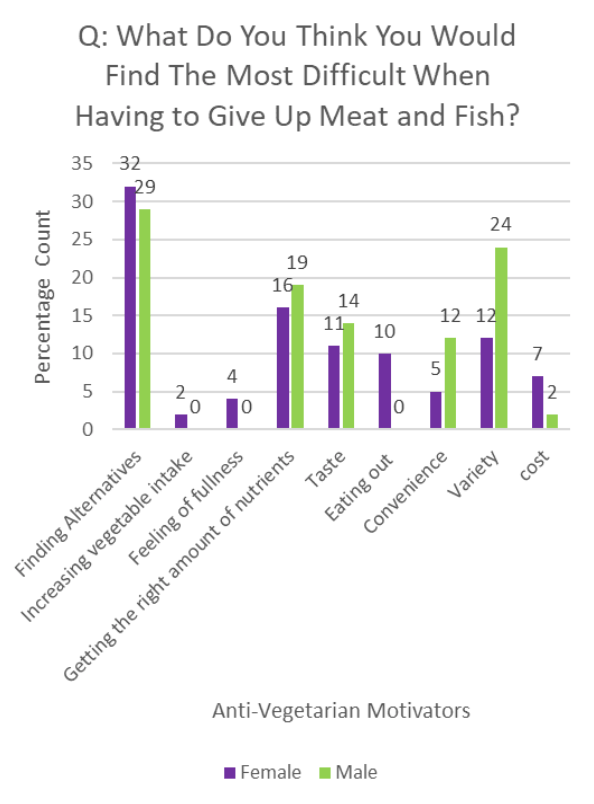
Table 1: Statistical analysis for Figures 7 and 8
| Figure | Null hypothesis | Critical two-tail value | T-Stat Value | Reject/Accept Null Hypothesis? | Statistically Significant/Insignificant? |
| 7 | ‘There is no difference between males and females in their possible pro-vegetarian motivations’ | 2.228 | 2.439 | Reject | Significant |
| 8 | ‘There is no difference between males and females and their reasons for not being vegetarian’ | 2.160 | 0.611 | Accept | Insignificant |
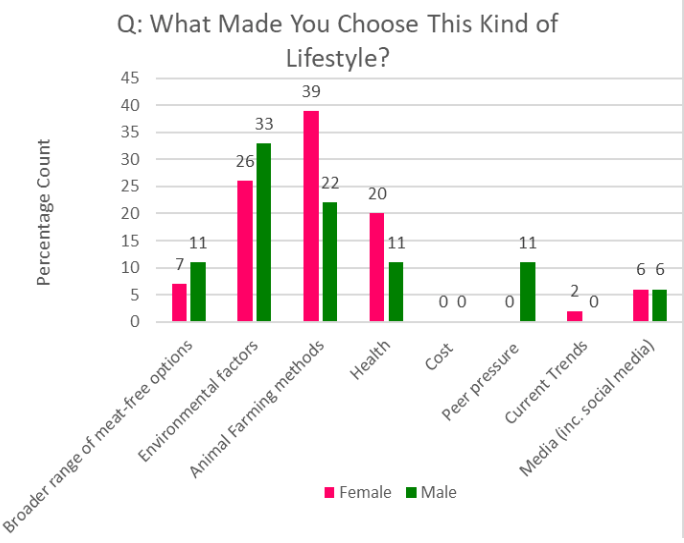
Statistically, males and females’ vegetarian motivations are different, furthered by the data in figure 7 showing males being more environmentally motivated whilst females require a broader range of options. Men are also more likely to opt not to become vegetarian.
Both genders felt the absence (or belief of the absence) of sufficient alternatives to be the main reason for not being vegetarian, as well as attaining necessary nutrient levels, taste and variety also being common. These similarities were reinforced by there being no statistically significant difference.
3.2 Vegetarian questionnaire
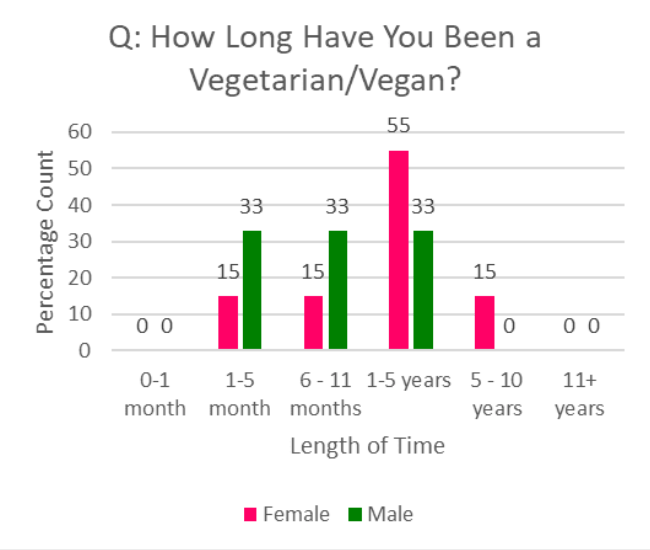
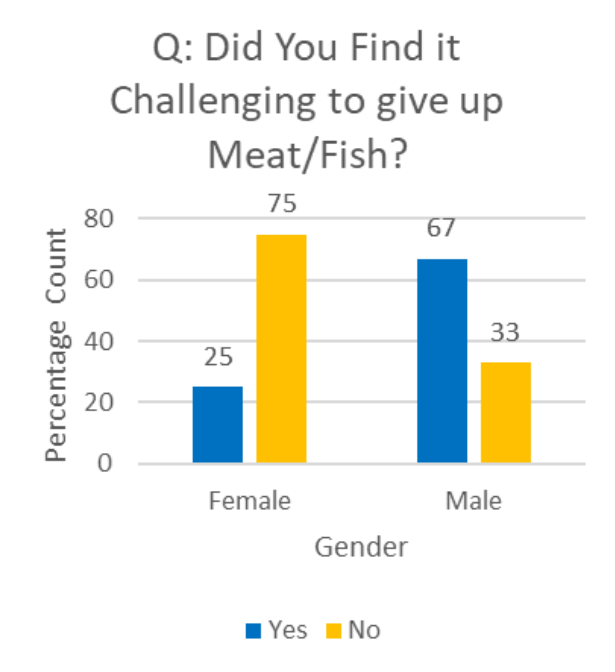


Female vegetarians, on average, had been following the vegetarian practice longer than male respondents (Fig. 9) whilst also finding it easier to give up meat than males (Fig. 10). Women were also more likely to have felt prejudice for their dietary choices. The majority of both genders felt that there were ‘usually’ options for them in day-to-day life, as well as both genders citing that their diet had impacted those around them, more commonly for family.
| Figure | Null Hypothesis | Critical Two-tail Value | T-Stat Value | Reject/Accept the Null Hypothesis? | Statistically Significant/ Insignificant? |
| 14 | ‘There is no difference between changes felt by males and females when becoming vegetarian’ | 2.145 | 3.303 | Reject | Significant |
| 15 | ‘There is no difference between males and females and their current dietary difficulties’ | 2.447 | 2.294 | Accept | Insignificant |
| 16 | ‘There is no difference in males and females and their motivations to become vegetarian’ | 2.228 | 2.366 | Reject | Significant |
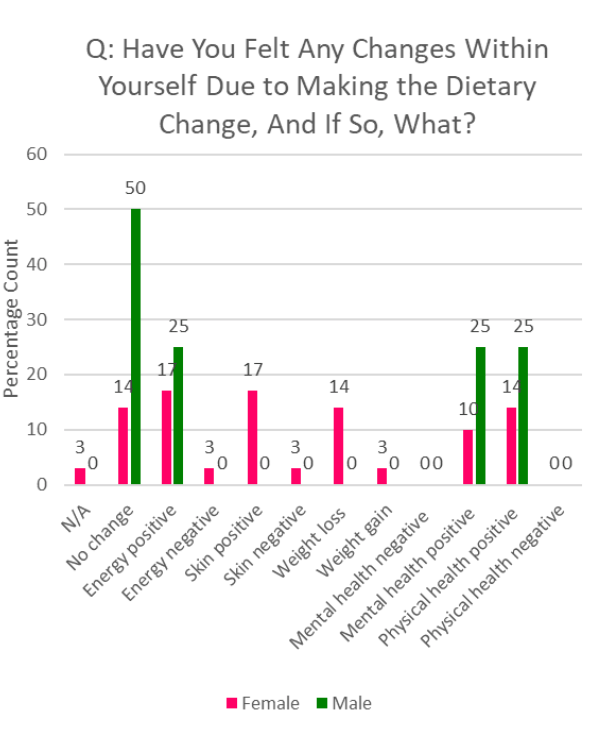
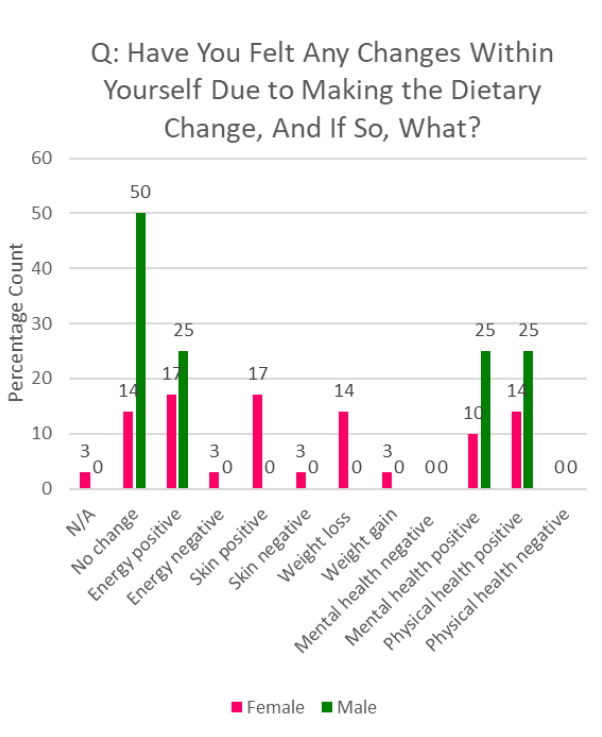
There was a statistically significant difference between males and females in the changes they felt since becoming vegetarian (Fig. 14), and their motivations to become vegetarian (Fig. 16). The majority of males said that they felt no change (Fig. 15) and were motivated by environmental factors (Fig. 16) whilst women mostly felt a positive change in energy and were more motivated by animal farming methods. Both genders did not cite any negative effects.
Whilst the results in figure 15 were not statistically significantly different, the graph shows dissimilarities between the genders; men found eating out and cost to be the most difficult factors compared to convenience and variety for women.
3.3 Vegetarian versus non-vegetarian data
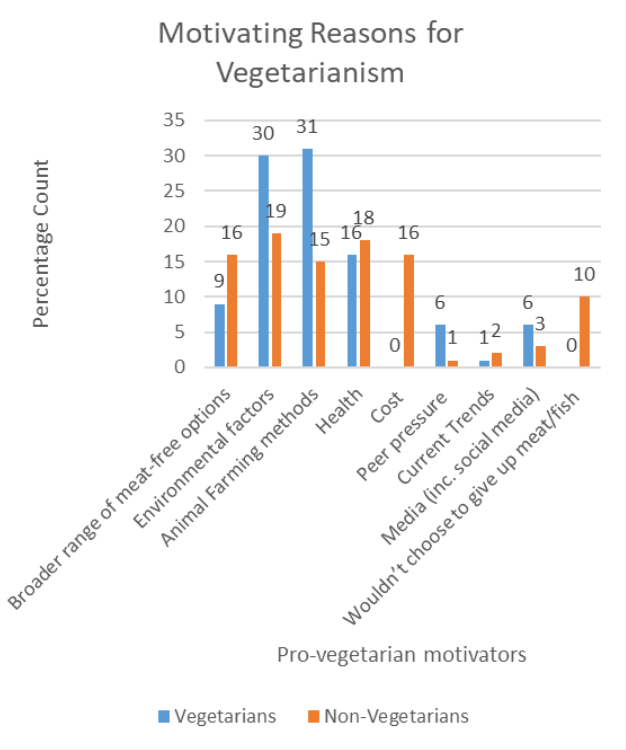
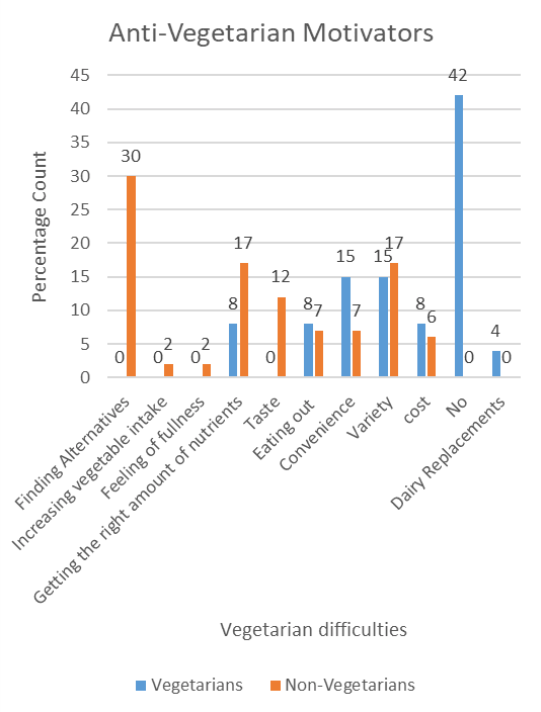
Figure | Null Hypothesis | Critical Two-Tale Value | T-Stat Value | Reject/Accept the Null Hypothesis? | Statistically Significant/ Insignificant? |
| 17 | ‘There will be no difference between vegetarians and non-vegetarians in their motivations behind vegetarianism.’ | 2.131 | 1.258 | Accept | Insignificant |
| 18 | ‘There will be no difference between vegetarians and non-vegetarians in their current and potential differences in a vegetarian diet’ | 2.179 | 2.472 | Reject | Significant |
There was no statistically significant difference between the groups and their motivations that already/potentially drive vegetarianism (Fig. 17). The top three most common factors for both groups of people were: environmental factors, animal farming methods, and health.
However, there was a statistical difference between the groups concerning dietary difficulties associated with vegetarianism. Most vegetarians do not have difficulties whilst non-vegetarians felt they would have few alternatives if following the same diet (Fig. 18). Both groups, however, felt variety, eating out and cost is a vegetarian difficulty.
3.4 Emissions data
| Total Meals | Total Vegetarian Meals | Total Non-Vegetarian Meals | Total Emissions (KgCO₂e) | Total Vegetarian Emissions (KgCO₂e) | Total Non-Vegetarian Emissions (KgCO₂e) | |
| Restaurant Emissions | 211,432,295 | 47,487,694 | 163,944,602 | 734,163,655 | 27,447,887 | 706,715,768 |
| Personal Emissions | 4,532,796,061 | 2,582,269,724 | 1,950,526,337 | 4,700,000,583 | 790,174,536 | 3,909,826,048 |
| Potential Annual Emissions (KgCO2e) | Potential Annual Emissions Saving (KgCO2e) | Emissions Saved | |
| Restaurant emissions | 122,207,867 | 611,955,788 | 2.9kg per meal |
| Personal emissions | 1,387,035,595 | 3,312,964,988 | 764.7kg per capita |
| Total Annual Emissions | 1,509,243,462 | 3,924,920,776 | 905.9kgCO2e per capita per year |
Total calculated emissions saved by city-wide vegetarianism is equivalent to 0.85% of the UK’s overall emissions (CAIT, 2020).
4. Discussion
City-wide vegetarianism across Birmingham is unattainable, as indicated by 19% male and 7% female NV saying they would refuse to give up meat and fish. The larger proportion of males within that ratio may be due to societal association of meat with masculinity, creating a reluctance to give up meat in fear of being perceived as ‘weaker’ (Rosenfeld, 2020).
The Birmingham population resonates strongly with environmental factors (30% V and 19% NV), more so than other motivating factors such as health, which has been a stronger motivator previously (Fox and Ward, 2007). Ethics (animal farming methods) is a resounding motivator for vegetarians both in this study (31%) and in previous studies (Fox and Ward, 2007), however not for non-vegetarians (15%).
Buying behaviour between vegetarians and non-vegetarians differs due to psychological factors. Altruism in vegetarians leads to connection between food and its origin (Bacon, 2018; Dhakal, 2014). Whilst non-vegetarians do not experience this as strongly, utilisation of the environmental awareness non-vegetarians have (79% males, 74% females) may be useful for introduction of flexi- and vegetarian consumption habits. It may also be useful in reducing the negative societal connotations between men and meat (Rosenfeld, 2020).
Including health and financial benefits discussed in previous studies may further be used as motivation towards a vegetarian lifestyle as Flynn and Schiff (2012) found animal products to be the most expensive component of meals. Use of social influence through peers may also be useful, as 70% females and 66% males (V) stated their diet had an impact within their social circles. Previous research also shows that social pressure influences consumer buying behaviour (Jung Jang et al., 2011).
This study only took the main protein source into account and not the other dish components, place of origin, cooking or growing technique such as previous studies have done (Madin and Macreadie, 2015; Flynn and Schiff, 2012; Leuenberger, 2010; Helenius, 2009; Carlsson-Kanyama, 1998). However, it still produced a comparable estimated emissions savings of 2.9 kg CO2e per meal in vegetarian-only Birmingham restaurants and 0.70 kg C02e per at-home meal.
Similar studies modelling vegetarianism found an emissions reduction of 20% and 15-25% per capita annually compared to 13.68% per capita in this study (Grabs, 2015; Hallstrom et al., 2014). However, Swedes eat an extra 1.5kg of meat per person annually whilst emitting 1.43 tonnes of CO2e per capita annually less than Britons (Statistics Sweden 2019; Knoema, 2018).
The emissions saving by the vegetarian Chinese and Mahayan Buddhists is calculated to be equivalent to 7.2% and 8.9% of the UK’s (2012) annual greenhouse gas emissions (Tseng, 2017a, 2017b). This study’s emissions saving is equivalent to 0.7% using the same emissions data or 0.85% using more recent (2016) emissions data (CAIT, 2020), reiterating that wide-scale consumer change is needed for an observable effect (Helenius, 2009).
5. Conclusion
City-wide implementation of vegetarianism in Birmingham is calculated in this study to save emissions of ~ 39254 kilotonnes CO2e. On average that is approximately 906kg CO2e per person annually.
The majority of the Birmingham population are environmentally aware with an understanding of the environmental benefits of reducing animal products in their diet. However, reluctance to adopt vegetarianism is commonplace amongst the population, therefore more information is required in order for integration of a vegetarian diet and consequential emissions reduction.
Further research could be employed to increase the validity of the results by having a larger study sample or sampling all of the suburbs’ emissions individually rather than generalising.
6. Acknowledgements
I would like to thank Timothy Lane for his continued support throughout my dissertation, and both Timothy Lane and Celine Germond-Duret for co-authoring this article.
7. References
Aleksandrowicz, L., Green, R., Joy, E.J., Smith, P. and Haines, A., 2016. The impacts of dietary change on greenhouse gas emissions, land use, water use, and health: a systematic review. PloS one, 11(11).
Bacon, L. and Krpan, D., 2018. (Not) Eating for the environment: The impact of restaurant menu design on vegetarian food choice. Appetite, 125, pp.190-200.
CAIT 2020 Greenhouse Gas Emissions and Emissions Targets [online] Available at: https://www.climatewatchdata.org/countries/GBR [Accessed 17 June 2020]
Chandrasekar, K.S & Harikumar, P. (2019). Restaurant Business. 15. 190-197.
Crane, A., 2000. Facing the backlash: green marketing and strategic reorientation in the 1990s. Journal of Strategic Marketing, 8(3), pp.277-296.
Dhakal, D. (2014): Feasibility Analysis of Indian Vegetarian Restaurant in Helsinki, Bachelor Thesis, Laurea University of Applied Sciences
Flynn, M.M. and Schiff, A.R., 2015. Economical healthy diets (2012): Including lean animal protein costs more than using extra virgin olive oil. Journal of hunger & environmental nutrition, 10(4), pp.467-482.
Food Standards Agency (2018): The Food and You Survey Wave 4, p62 [online] Available at: https://www.food.gov.uk/sites/default/files/media/document/food-and-you-w4-combined-report_0.pdf [Accessed 1 Feb 2020]
Fox, N., Ward, K., (2007): Health, Ethics and Environment: A Qualitative Study of Vegetarian Motivations Appetite, 50(2-3), pp.422-429.
Freeman, E.M., 2011. Restaurant industry sustainability: barriers and solutions to sustainable practice indicators. MSc Thesis Arizona State University.
GOV.UK. (2019). Family food datasets. [online] Available at: https://www.gov.uk/government/statistical-data-sets/family-food-datasets [Accessed 10 Feb. 2020].
Hallström, E., Röös, E. and Börjesson, P., 2014. Sustainable meat consumption: A quantitative analysis of nutritional intake, greenhouse gas emissions and land use from a Swedish perspective. Food Policy, 47, pp.81-90.
Ivanova, D., Barrett, J., Wiedenhofer, D., Macura, B., Callaghan, M.W. and Creutzig, F., 2020. Quantifying the potential for climate change mitigation of consumption options. Environmental Research Letters. Accepted Manuscript online 1 April 2020.
Jang, Y.J., Kim, W.G. and Bonn, M.A., 2011. Generation Y consumers’ selection attributes and behavioral intentions concerning green restaurants. International Journal of Hospitality Management, 30(4), pp.803-811.
Kelly, G., 2012. Sustainability at home: Policy measures for energy-efficient appliances. Renewable and Sustainable Energy Reviews, 16(9), pp.6851-6860.
Knoema. (2018)b. Sweden CO2 emissions per capita, 1970-2019 – knoema.com. [online] Available at: https://knoema.com/atlas/Sweden/CO2-emissions-per-capita [Accessed 18 Feb. 2020].
Madin, E.M. and Macreadie, P.I., 2015. Incorporating carbon footprints into seafood sustainability certification and eco-labels. Marine Policy, 57, pp.178-181.
PETA. n.d. Most Vegetarian-Friendly City: London | PETA. [online] Available at: <https://www.peta.org/features/london-veg-friendly/> [Accessed 17 March 2020].
Pohjolainen, P., Tapio, P., Vinnari, M., Jokinen, P. and Räsänen, P., 2016. Consumer consciousness on meat and the environment—Exploring differences. Appetite, 101, pp.37-45.
Poore, J. and Nemecek, T., 2018. Reducing food’s environmental impacts through producers and consumers. Science, 360(6392), pp.987-992.
Raphaely, T. and Marinova, D., 2014. Flexitarianism: Decarbonising through flexible vegetarianism. Renewable Energy, 67, pp.90-96.
Rosenfeld, D.L., 2020. Gender differences in vegetarian identity: How men and women construe meatless dieting. Food Quality and Preference, 81, p.103859.
Scarborough, P., Appleby, P.N., Mizdrak, A., Briggs, A.D., Travis, R.C., Bradbury, K.E. and Key, T.J., 2014. Dietary greenhouse gas emissions of meat-eaters, fish-eaters, vegetarians and vegans in the UK. Climatic change, 125(2), pp.179-192.
Schlegelmilch, B.B., Bohlen, G.M. and Diamantopoulos, A., 1996. The link between green purchasing decisions and measures of environmental consciousness. European journal of marketing, 30(5), pp.35-55..
Smith, S. and Paladino, A., 2010. Eating clean and green? Investigating consumer motivations towards the purchase of organic food. Australasian Marketing Journal (AMJ), 18(2), pp.93-104.
The Vegan Society. (2019). Statistics. [online] Available at: https://www.vegansociety.com/news/media/statistics [Accessed 29 Oct. 2019].
Tseng, A.A., 2017a. Reduction of greenhouse-gas emissions by Chinese Buddhists with vegetarian diets: a quantitative assessment. Contemporary Buddhism, 18(1), pp.89-107.
Tseng, A.A., 2017b. Equivalent reduction in greenhouse gas emissions by Mahayana Buddhists practicing vegetarian diets. Journal of religion and health, 59(1) pp.1-16.
Worldpopulationreview.com. (2019). [online] Available at: http://worldpopulationreview.com/world-cities/birmingham-population/ [Accessed 7 Feb. 2020].
#Write for Routes
Are you 6th form or undergraduate geographer?
Do you have work that you are proud of and want to share?
Submit your work to our expert team of peer reviewers who will help you take it to the next level.
Related articles
