
By Jennifer Thomas, University of Plymouth
Citation
Thomas, J. (2022) An investigation into how the widening of two crevasses in Pine Island Glacier led to the calving of the B-49 iceberg. Routes 2(3): 183-192
Abstract
With climate change continuing to threaten glaciers around the world, studies of Antarctic ice sheets have never been more prevalent. This report outlines the findings from a research project by the climate change research group at The Ladies’ College, Guernsey. Facilitated by the Institute of Research in Schools (IRIS), satellite images of Pine Island Glacier from Sentinel 1 were downloaded and the change of width of two significant crevasses were measured using Q-GIS software. It was found that, since the formation of the crevasses in July 2019, they continued to widen until the calving of the iceberg in February 2020. The change of rate of widening followed a similar pattern of increasing and plateauing, between the two crevasses, with the more northern crevasse showing a greater rate of widening over time.
1. Introduction
On 8th February 2020 a 100km2 iceberg later dubbed B-49 (National Geographic , 2020), along with multiple other fragments of ice, broke from Pine Island Glacier (PIG) on the Western Antarctic Ice Sheet (WAIS). Previous to its calving, two noticeable crevasses were formed, which were monitored via satellite imagery and measured over the course of six months; the results of which will form the basis for this report.
PIG is one of the fastest contributors of sea ice in the world and it’s continuously thinning (Rémy, 2012). This is likely due to PIG’s extremely deep grounding line being 2500m below sea level.
The deep grounding line leaves PIG exposed to sub-glacial sea circulation, encouraging basal melting of the ice shelf. This melting enhances the circulation of warm water beneath the shelf as the cold, buoyant melt water flows seaward. Increased circulation will then continue to melt the base of the ice shelves as well as speed the flow of the glaciers, therefore enhancing the process (Bamber, 2020).
This is an important concept to understand as it explains why glaciers and ice shelves are melting at an exponential rate, especially in WAIS. It is likely that this process drove the formation of the two crevasses studied in this report.
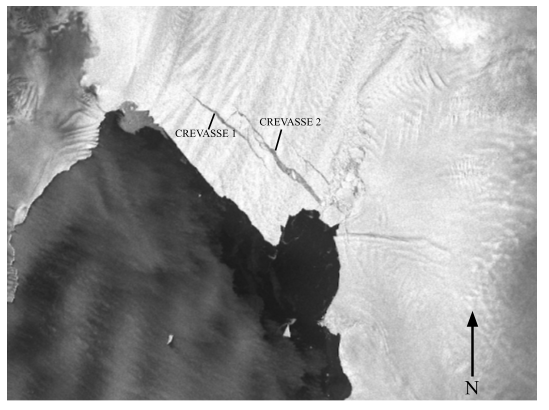
Figure 2 is an example of the satellite imagery used to monitor the crevasses, with each named as they will be from this point forward. Both crevasses were measured on a constant basis to answer the question:
How does the width of the crevasses change over time?
This study has important social implications as it provides an insight into the speed of widening of glacial crevasses and this change over time. An understanding of this is crucial to provide glacial melt predictions and their contribution to sea level rise in the future; as well as other environmental factors that glacier melt contributes to such as the slowing of the oceanic current system by preventing the sinking of cold, dense water in the polar regions.
2. Methodology
This research was initialised through a project by the Institute of Research in Schools (IRIS) named ‘MELT Antarctica’. The project facilitated access to Sentinel 1 satellite imagery of various glaciers in Antarctica through the Centre for Polar Observation and Modelling (CPOM) website. The type of data collected from these images and the specific location was chosen by those participating, creating unique and innovative projects from developing data.
For this particular study, PIG was chosen due to its vulnerability and key impact on glacial outflow. The two crevasses were clear from initial images which lead to the independent decision to monitor their width over time, providing new quantitative data that could be analysed.
To gain this data, the images were downloaded onto a Quantum Geographical Information System (QGIS) software which included a measuring tool. The benefit of this system is that it is free to download on any computer, making it an accessible resource. On each image, ten measurements of width were taken along varying points of each crevasse. These ten measurements were then averaged to give a single value for the width of each crevasse from every sample image. This process was the most efficient method for obtaining average width values that could be compared between images however it exposes the data to limitations in accuracy: averaging ten data points may not provide a true value for the average width of the crevasse, potentially weakening the validity of the results.
Data was taken from 32 images dated between July 2019 and February 2020.
Once fully collated, the average widths of each crevasse were plotted onto separate graphs relative to the number of days that had passed since the first sample was taken. This enabled an accurate representation of change in width over time. Error bars were added in an attempt to minimise accuracy errors caused by the limitations of the data-collection methods.
3. Results
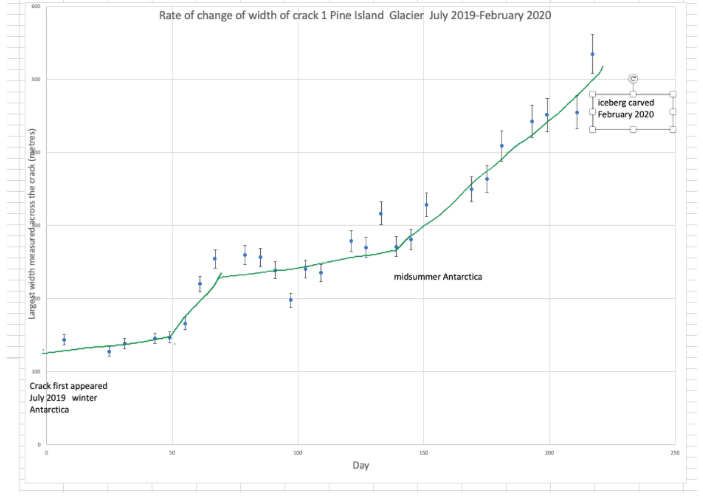
Figure 3 shows how the width of crevasse 1 changed over the monitored period, with the general trend showing that the crevasse continued to widen over time. The rate of widening changed incrementally, increasing after day 50 before decelerating again around day 70 and then further increasing around day 140, which was maintained until the iceberg calved.
The first measurement was taken of the sample from 10th July 2019, giving an average width of 143.50m. Comparing this to the final measurement taken from 5th February 2020, averaging 531.56m, the overall change in width over the 209 days was 388.06m.
Looking more closely at the change in rate, the graph can be broken down into four sections:
Section 1 – Days 0-50
Section 2 – Days 50-70
Section 3 – Days 70-140
Section 4 – Days 140-209
During section 1, the crevasse widened by 21.84m over 50 days, giving an average rate of 0.44m/day over this period. Section 2 saw a serious increase in the rate of widening. Over the 20-day period the crevasse widened by 34.58m, giving an average rate of 1.73m/day for this section. During section 3, the rate plateaued to 0.50m/day after widening 34.67m over 70 days. Over the 69-day period of section 4 the crevasse widened by 180.71m, giving an average rate of widening of 2.62m/day.
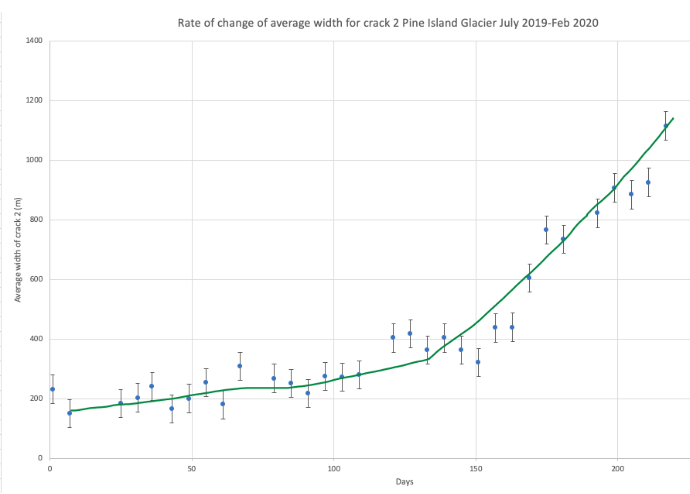
Figure 4 shows how crevasse 2 widened over the monitored period. The graph has less definitive changes in rate compared to that of crevasse 1 however there is an increase in rate around day 140, similar to crevasse 1.
The crevasse widened by 965.22m over the 209 days, starting at 149.47m and finishing as 1114.69m. This final width was considerably wider than crevasse 1, by 583.13m.
To highlight the rate of change of width for crevasse 2, the graph can be split into two sections:
Section 1 – Day 0-140
Section 2 – Day 140-209
The crevasse widened by 130.05m over the 140 days of section 1, at an average rate of 0.93m/day. Section 2 saw an increased rate of widening of 10.90m/day, widening by 752.39m over just 69 days. Overall, the rate of widening for crevasse 2 was faster than crevasse 1, with the widening of crevasse 2 after day 140 being 4.16 times faster than the same time period for crevasse 1.
4. Discussion
Despite the methodology limiting the true accuracy of the measurements, the trend of the plotted data points with error bars shows clear widening of both crevasses over time, with the rate of widening also increasing sporadically. Although the exact measurements may be subject to inaccuracy, the general trend can be used to understand the glacier’s movement patterns.
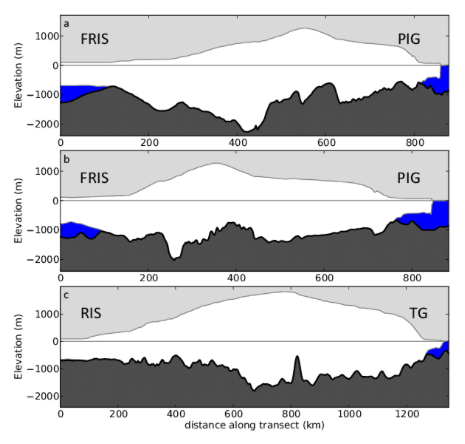
The sporadic increases can be explained by the non-linear viscosity of the glacial ice. Glen’s Flow Law refers to change in strain rate, appreciating the fact that a glacier’s response to stress is non-linear with applied stress (Evans, 2018). Figure 5 below shows the potential temperature gradient on PIG, modelling that the further from the grounding line, the greater the temperature.
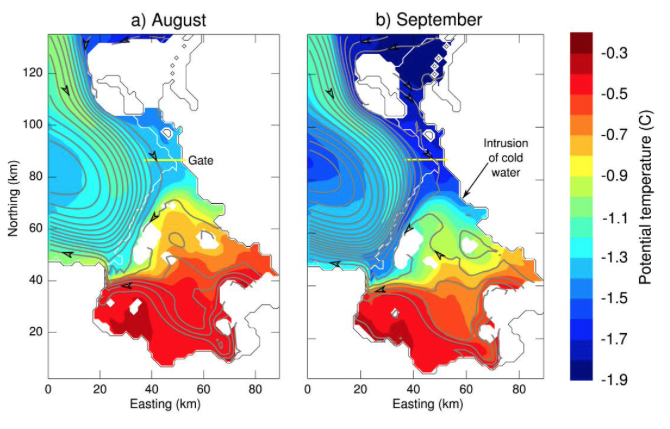
Evidentially, stress can vary throughout the glacier; explaining why crevasse 1 experienced an initial increase in the rate of widening whereas crevasse 2 did not. Figure 5 also shows an intrusion of cold water in September, which may have aided the deceleration of the rate of widening around day 70 (19th September 2019).
The idea of disparity in rate of change within the glacier is supported by Flament and Rémy’s study into the thinning of PIG (2012). Their meta-analysis concluded that the thinning of PIG is accelerating and propagating towards southwards at 40kma-1 (Rémy, 2012). This conclusion could also be used to support the increased rate of widening that crevasse 1 experienced but crevasse 2 did not.
As a supporting study, this research highlights that PIG is continuing to lose ice at an exponential rate: as a result of the oceans absorbing more heat due to climate change, more warm water is being circulated around the base of PIG and therefore aiding its accelerated thinning. This magnifies the problem further as there is less ice to reflect solar heat, allowing the surrounding oceans to absorb more, creating an expedited positive feedback loop.
Seasonal changes have a similar effect but with intensified warming over a shorter period of time. The austral summer causes warmer temperatures which aid the growth of any faults in the glaciers. This would cause an increased rate of widening, explaining that seen after day 140 (28th November 2019).
After this point, the rate of widening for crevasse 2 increased 10-fold. The suddenness of this increased rate can be accounted for by the ice’s non-Newtonian properties, allowing it to flow under the force of gravity until the force begins to exceed the yield stress of ice, causing it to snap (Bamber, 2020) which would have likely occurred around day 140, accelerating the rate of widening under decreased pressure.
Although the velocity of the widening of the crevasses was not constant, it did increase with time. This suggests that the rate of flow of the glacier was also increasing, adding pressure to the faults until this exceeded its yield stress and a calving occurred. This calving created the B-49 iceberg along with other fragments of ice. Although calving is a natural part of the glacial movement, these events are becoming more frequent as anthropogenic influences are accelerating climate change (Holmes, et al., 2019). Warming sea temperatures and increased positive feedback loops are stimulating increased glacial melt at a concerning rate. The global implications of melting glacial ice are detrimental, including the deceleration of oceanic current systems due to less dense polar ice as well as rising sea levels through added water by glacial melt. Predictions of how these impacts will manifest in the future will only be possible through an understanding of the source: glacial erosion as a result of warming seas. These predictions are important to understand so that management strategies can be put in place in vulnerable areas such as low-lying islands that will inevitably experience the impact of eustatic sea level rise.
5. Conclusion
As carbon emissions rise to meet anthropogenic demands, polar temperatures are increasing and causing the thinning of glaciers such as PIG. The accelerated flow of glaciers through increased basal melt allows for faults in the glacier to widen until a point at which a calving occurs. The B-49 iceberg calving was a result of two crevasses in PIG which experienced augmented widening between July 2019 and February 2020.
The rate of widening was not reflected equally between the two crevasses with the rate varying more for crevasse 1 however the overall rate being greater for crevasse 2; a result of a disparity in temperature and pressure within the ice shelf. The variation of the stresses within the ice shelf could be subject to further research in order to deepen the understanding of how crevasses within the same glacier respond differently.
The findings in this study can be supported by similar research such as Flament and Rémy (2012) and St-Laurent (2015), aiding its external validity. From this it is noticeable that glacial speed is increasing, resulting in more frequent iceberg calvings.
B-49 will be vulnerable to further melt at sea, contributing to the added volume of meltwater in the ocean. These events reinforce the circulation of water beneath ice shelves, creating positive feedback that will exacerbate the melting further. This is leading to global implications in both the human and natural world, amplifying the importance of understanding processes such as glacial cracking hence endorsing the significance of this study.
6. Acknowledgements
Accessing the data for this research was made possible through IRIS. All data was collected and analysed by the Ladies’ College climate science research team during the 2019-20 academic year which consisted of: Jennifer Thomas (author), Pia Thapliyal, Rachel Simon and Pascale Carpentier. Special thanks should be given to Dr Karen Marshall who organised the groups’ involvement with the project and whose ideas and expertise were indispensable.
7. References
Bamber, J., 2020. [Interview] (31 07 2020).
CPOM, 2019. Centre for Polar Observation and Modelling Data Portal. [Online]
Available at: http://www.cpom.ucl.ac.uk/csopr/
Evans, D. J. A., 2018. Glaciation: A very short introduction. Oxford: Oxford University Press.
Feldmann, J. & Levermann, A., 2015. Interaction of marine ice-sheet instabilities in two drainage basins: Simple scaling of geometry and transition time. The Cryosphere, 9(2).
Holmes, F. A. et al., 2019. Relating ocean temperatures to frontal ablation rates at Svalbard tidewater glaciers: Insights from glacier proximal dataset. Scientific Reports, 9(1).
National Geographic , 2020. National Geogrphic. [Online]
Available at: https://www.nationalgeographic.co.uk/environment-and-conservation/2020/02/huge-iceberg-just-broke-west-antarcticas-most-endangered
Oxford Reference, 2020. Glen’s Flow Law. Available at:
https://www.oxfordreference.com/view/10.1093/oi/authority.20110803095854948. [Accessed April 27, 2021].
Rémy, T. F. a. F., 2012. Dynamic thinning of Antarctic glaciers from along-track repeat radar altimetry. Journal of Glaciology, 58(211), pp. 830-840.St Laurent, P., 2015. Impact of local winter cooling on the melt of Pine Island Glacier, Antarctica. Journal of Geophysical Research: Oceans, 120(10), pp. 6718-6732.
#Write for Routes
Are you 6th form or undergraduate geographer?
Do you have work that you are proud of and want to share?
Submit your work to our expert team of peer reviewers who will help you take it to the next level.
Related articles
