
Volume 3 Issue 3
By Constance Gerono (Liverpool John Moores University) and Dr Sarah Percival (Liverpool John Moores University)
Citation
Gerono, C. and Percival, S. (2023) A Street Level Flood Risk Assessment of Morpeth, UK. Routes 3(3): 159-177.
Abstract
This study presents a detailed street level flood risk assessment of Morpeth, UK, a town with a history of devastating flood events, most recently in 2008 and 2012. Flood risk in Morpeth was calculated at street level by multiplying hazard and vulnerability indexes that involved the quantification of components relating to the environment and population (flood vulnerability). The main findings highlighted a greater number of streets will be inundated during a 1-in-1000-year event and the most influential vulnerability characteristics in Morpeth are the presence of critical infrastructure, impermeable surfaces, population density and age and vehicle access. The streets most a risk in Morpeth were Gas House Lane, Wellwood Gardens and Staithes Lane. In relation to the future flood risk in Morpeth, the predicted increase of fluvial flooding events due to climate change produces a requirement to improve the adaptive capacity of the town to ensure a greater resilience against flood events in the future.
1. Introduction
Globally, flooding is considered one of the most frequent and devastating natural disasters experienced by the world’s population and these events are projected to increase in frequency and magnitude due to climate change (Wilby et al., 2008; Balica, Douben and Wright, 2009; Balica and Wright, 2010). This emphasises the importance and necessity to improve our knowledge of these events, and the need to develop reliable methods to identify high flood risk areas (Kourgialas and Karatzas, 2017; Toosi et al., 2019).
Risk can be defined as the product of a hazard and its consequences. Therefore, conducting a flood risk assessment is a multi-parametric approach, assessing flood hazard (a physical event or phenomenon that can cause loss of life, injury, social, economic, and environmental loss) and vulnerability (a complex interaction of the susceptibility of a population, economy, infrastructure, and environment to a hazard) (Birkmann, 2006: Kourgialas and Karatzas, 2017). It is also important to recognise that due to variants in the degree of vulnerability, hazard can be experienced differently on a local scale (Balica et al., 2012; Percival and Teeuw, 2019). This highlights the importance of analysing vulnerability at a level of high spatial resolution to establish effective solutions.
This report investigates fluvial flooding in an urban environment, with the aim of providing a detailed street level flood risk assessment of Morpeth, United Kingdom (UK) (Figure 1). This is to gain a thorough understanding of the town’s capacity to cope during and after a flooding event. This will be achieved through the production of a flood hazard and vulnerability index (FHI and FVI). These indexes are unique due to the choice of variables to represent vulnerability can produce diverse results (Fernandez et al., 2016). Morpeth was selected as the study site due to its recent history of flooding events in September 2008 and 2012, as well as many of its population living within the flood plain of the River Wansbeck (Javadinejad, 2011).
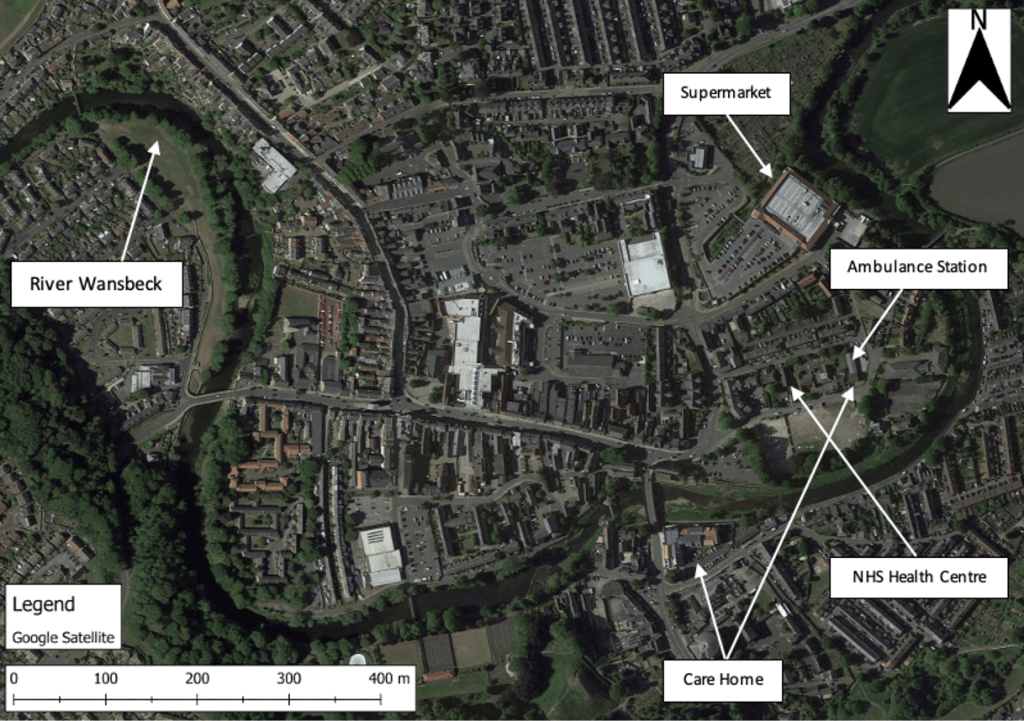
Figure 1: A map displaying the location of Morpeth, UK, including the surrounding environment of the River Wansbeck and the critical infrastructure within the town
2. Methodology
Data collection for this study involved 5 main steps. These can be seen summarised in the flow chart below (Figure 2), and further detail of each step is in the following text in Section 2.
2.1 Flood Hazard Index
Measuring flood hazard involves the establishment of the threat of an event and its probability of occurrence (Kron, 2005). To measure flood hazard in Morpeth, study streets were chosen in conjunction with Flood Zones 2 and 3 (FZ2/FZ3), datasets provided by GOV.UK that highlight areas in the UK where flooding could occur during events of varying magnitudes (Figure 3) (DEFRA, 2020). Tables can be found below of the corresponding street numbers and names that have been measured (Table 1), as well as flood zones and their probability of occurrence (Table 2).
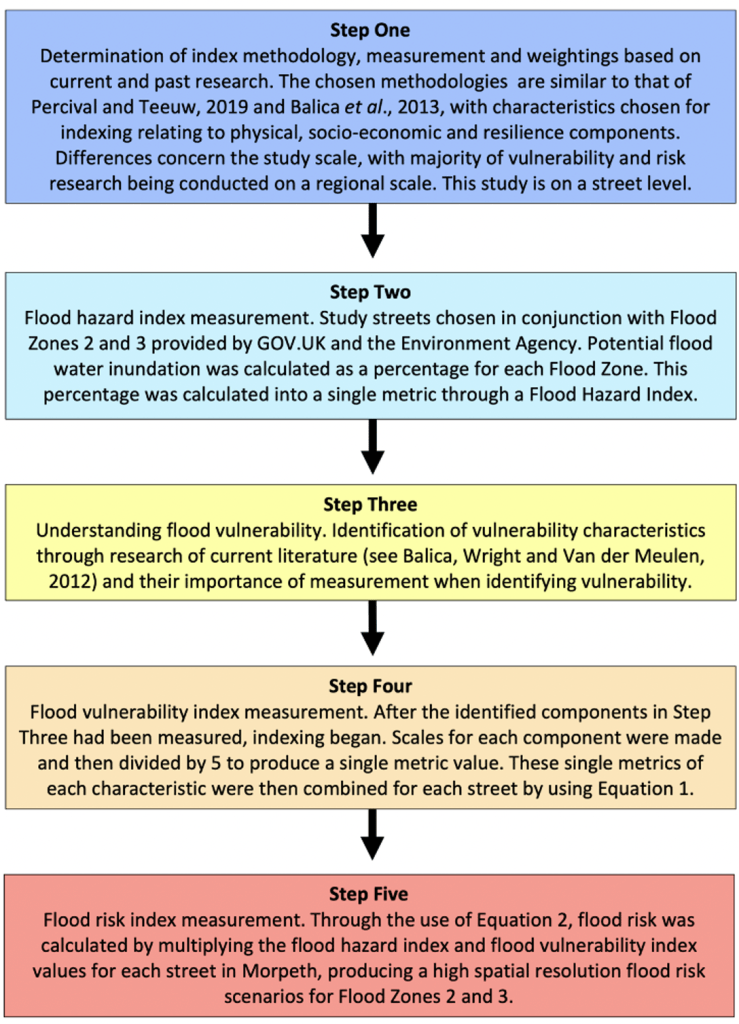
Figure 2: A flow chart of the five main methodology steps and a brief description of each step
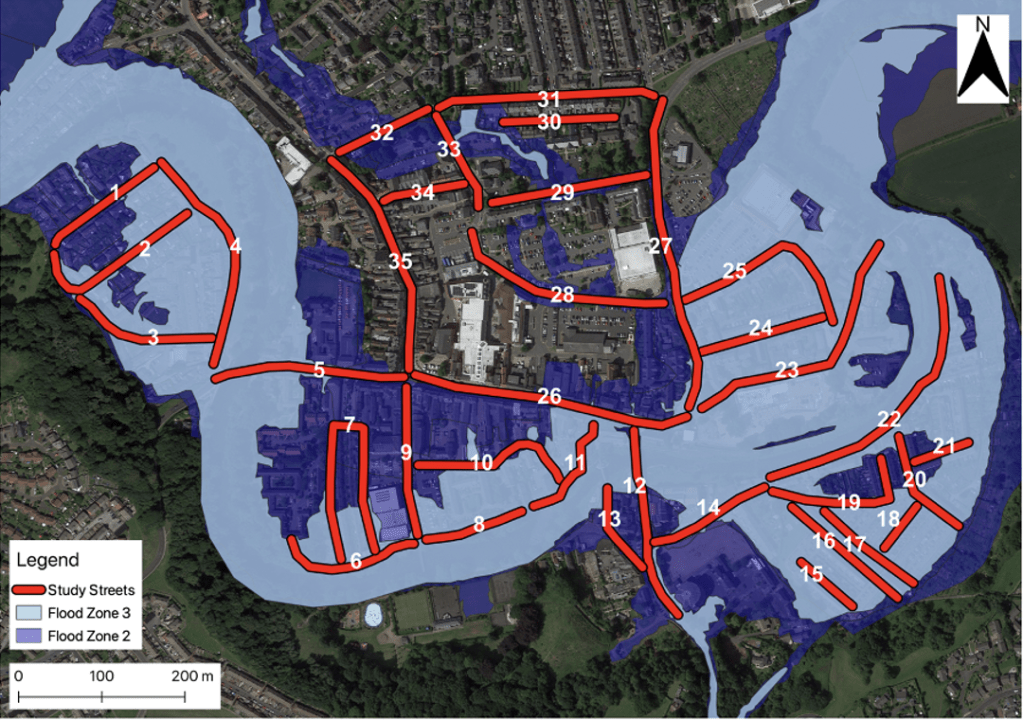
Figure 3: A map displaying Flood Zones 2 and 3 in Morpeth determined by the Environment Agency, as well as the 35 chosen study streets where data collection has taken place. Source: DEFRA (2020)
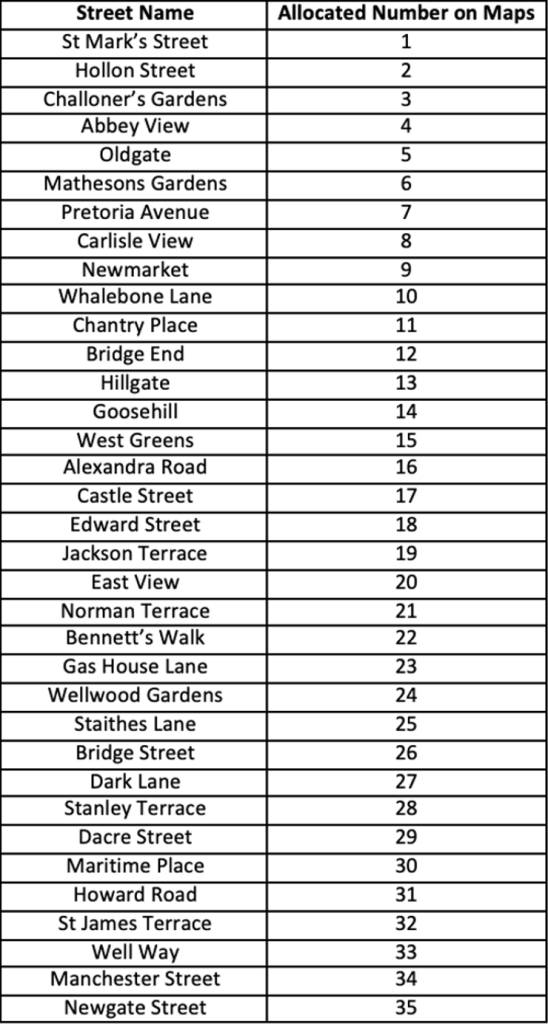
Table 1: A table of the street names that were measured in Morpeth and their corresponding number that was used in the production of maps
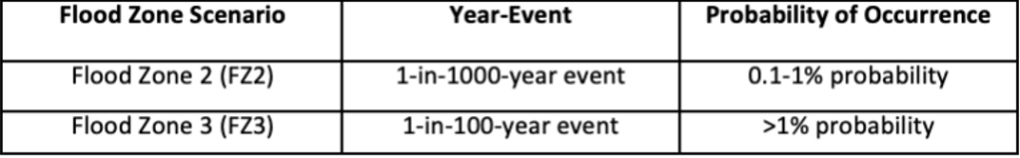
Table 2: A table displaying the conversion of Flood Zones to the equivalent year-event and probability occurrence
Initially, flood datasets were separately downloaded onto QGIS and the potential surface area of flood water inundation for each street was recorded as a percentage. For example, if a street was completely inundated it would be attributed a percentage of 100%, whereas if only half of the street was inundated by flood water, it would be attributed 50%. After all streets had been measured for both a FZ2 and FZ3 event, a FHI was produced to calculate numerical data into a single metric (Table 3).
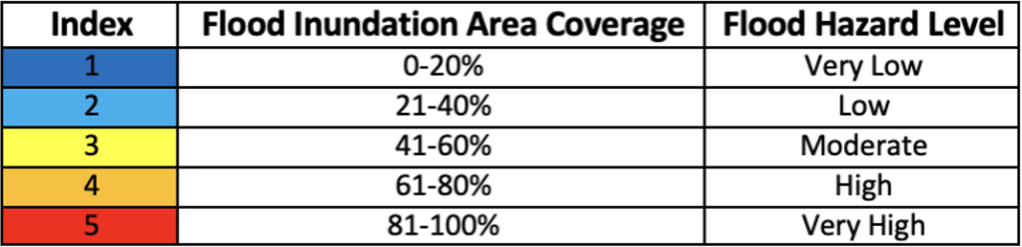
Table 3: A table displaying the FHI, and respective colour scheme used to indicated flood hazard level
2.2 Understanding Flood Vulnerability
A flood vulnerability assessment creates an understandable link between theoretical concepts of flood vulnerability and the day-to-day decision making of local populations (Balica et al., 2012). Therefore, measuring vulnerability involves the analysis of multiple inherent characteristics, which provide a larger representation of an area’s capacity to cope and recover (Balica et al., 2012). The main components of vulnerability measured (physical, socio-economic and resilience) in this study and the characteristics used to populate them are presented in Table 4 (Percival and Teeuw, 2019). It is important to recognise how chosen, and un-chosen vulnerability characteristics may influence end results. Such characteristics have been chosen for this study due to their predominant use in current literature (see Balica and Wright, 2010; Percival and Teeuw, 2019) as well as their accessibility during desk-based measurement. To carry out analysis with a combination of in the field and through desk-based measurements such as that done by Tascon-Gonzalez et al (2020) provides opportunity for a more accurate snap shot of populations (Tascon-Gonzalez et al., 2020). This is through a present-day representation of the current population in Morpeth rather than using Census data from 2011. However, if data collection was to be done in the field, observation methods such as foot fall counting can increase the likelihood of assumptions to be made regarding age and there is more opportunity for human error (Percival and Teeuw, 2019).
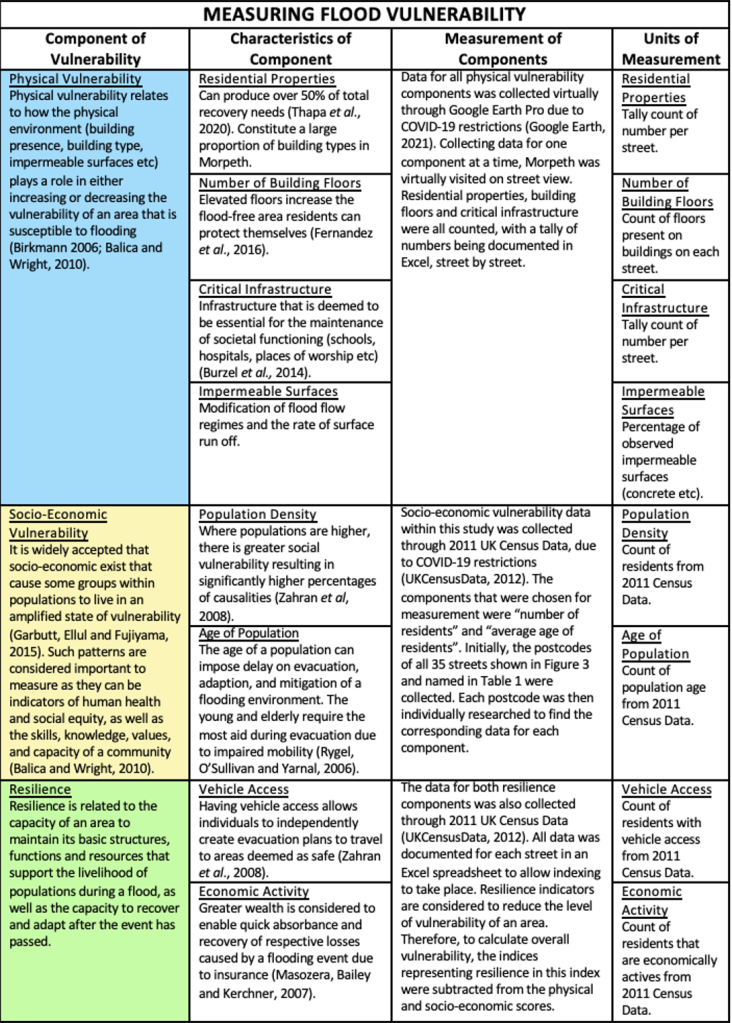
Table 4: A table providing further detailed information on the measured components of vulnerability and their various characteristics and units of measurement, as well as the colour scheme to represent the different components
2.3 Flood Vulnerability Index
After vulnerability components had been identified and measured, indexing began by creating scales for each characteristic. This was completed by dividing the highest possible total for each characteristic by 5, creating equal intervals between the lowest and highest outcomes (Table 5 and 6). Next, to calculate each streets vulnerability level, Equation 1 was used with each components index total. Equal weightings were chosen for this index as no independent judgement was made on the importance of characteristics. Other research with the decision for the use of equal weightings has been carried out by Balica et al., 2013 and Percival and Teeuw, 2019.
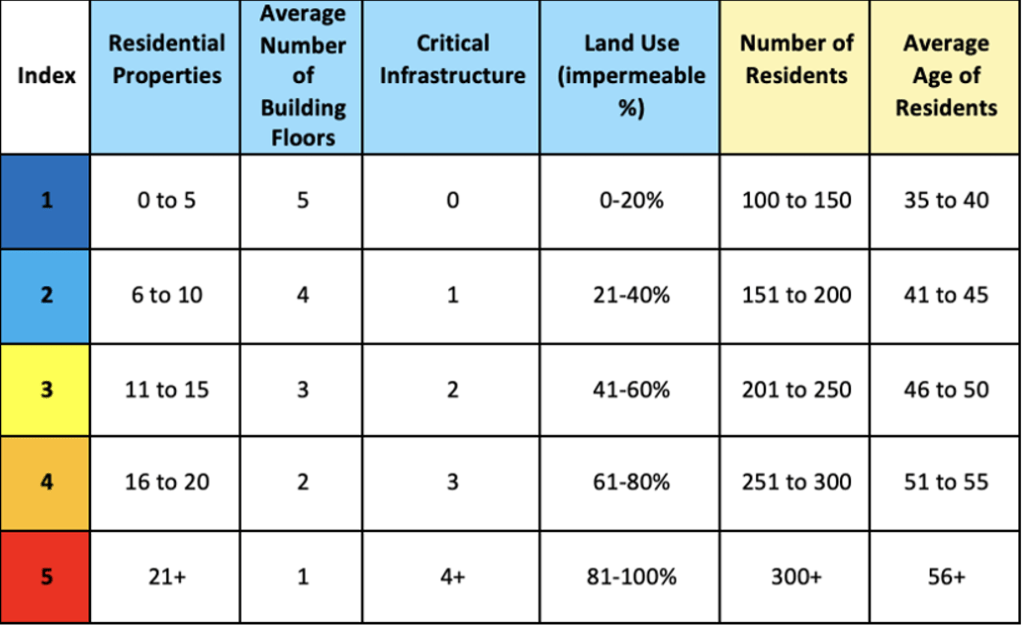
Table 5: A table displaying the respective index scale for physical and socio-economic vulnerability components. The colour scheme for vulnerability components represents the type of vulnerability (physical and socio-economic) and the index colour scheme represents the indication of the level of vulnerability used in the generation of maps in QGIS
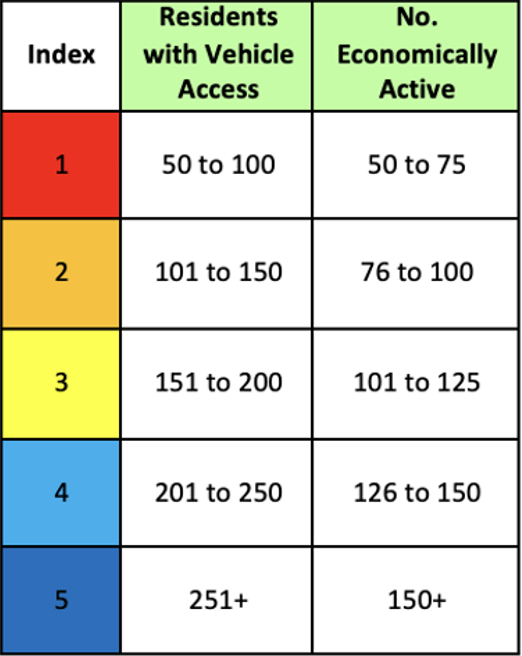
Table 6: A table displaying the respective index scale for resilience vulnerability components. The colour scheme for vulnerability components represents the type of vulnerability (resilience) and the index colour scheme represents the indication of the level of vulnerability used in the generation of maps in QGIS
VULNERABILITY = ((physical vulnerability + socio-economic vulnerability) – resilience) (1)
2.4 Flood Risk Index
Once street vulnerability index totals had been calculated, further indexing was carried out using Equation 2. This involved multiplying hazard and vulnerability to calculate the overall level of flood risk of each street. This allowed the production of a high spatial resolution street level flood risk scenario for a FZ2 and FZ3 magnitude event.
RISK = Hazard x Vulnerability (2)
3. Results
3.1 Flood Hazard
The results indicate that a greater number of streets will be acutely inundated in Morpeth during a FZ2 event. Figure 4 shows that 74.3% of study streets would be 80-100% inundated by water if a FZ2 event occurred. Considerably less study streets will be inundated to this degree if a FZ3 event occurred (Figure 5). During both events, the same pattern is found of streets that are more and least hazardous, with streets south of the River Wansbeck facing higher levels of hazard than those in the north.

Figure 4: A flood hazard map displaying the most and least affected streets during a 1-in-1000-year flooding scenario (Flood Zone 2) which has a 0.1-1% chance of occurring

Figure 5: A flood hazard map displaying the most and least affected streets during a 1-in-100-year flooding scenario (Flood Zone 3) which has a >1% chance of occurring
3.2 Flood Vulnerability
Many streets in Morpeth (68.6%) are considered to have a moderate level of vulnerability (Figure 6). These streets can be found north of the River Wansbeck. There are only two streets with high vulnerability (25 and 29), due to CI presence and high socio-economic vulnerability. The streets with the lowest levels of vulnerability are located south of the River Wansbeck, due to high resilience.

Figure 6: A FVI map displaying the streets in Morpeth that are regarded to have between a very low and very high vulnerability level
3.3 Flood Risk
During a FZ2 event, 4 streets have high levels of flood risk (7, 23, 24 and 25) (Figure 7). This is due to a combination of very high levels of flood water inundation and moderate or high levels of vulnerability. Streets 30, 31, 34 and 35 are least at risk due to moderate vulnerability or very low hazard levels. These 4 streets also have high, or very high levels of resilience.
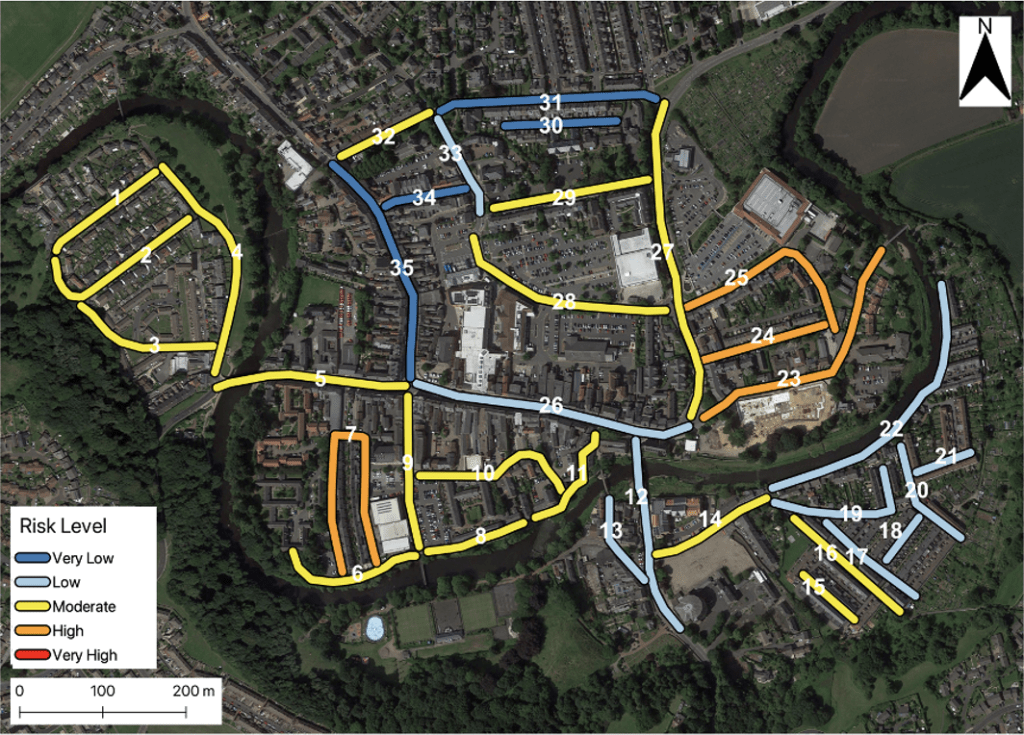
Figure 7: A flood risk map displaying the most and least affected streets of Morpeth during a 0.1-1% probability flood (Flood Zone 2)
During a FZ3 event, fewer streets in Morpeth are at risk of flooding (Figure 8). Streets 23, 24 and 25 remain to have high levels of flood risk, however, street 7 has changed from high to low risk. This is predominantly due to the change in levels of inundation during a FZ3 scenario i.e., flood water coverage would be less.
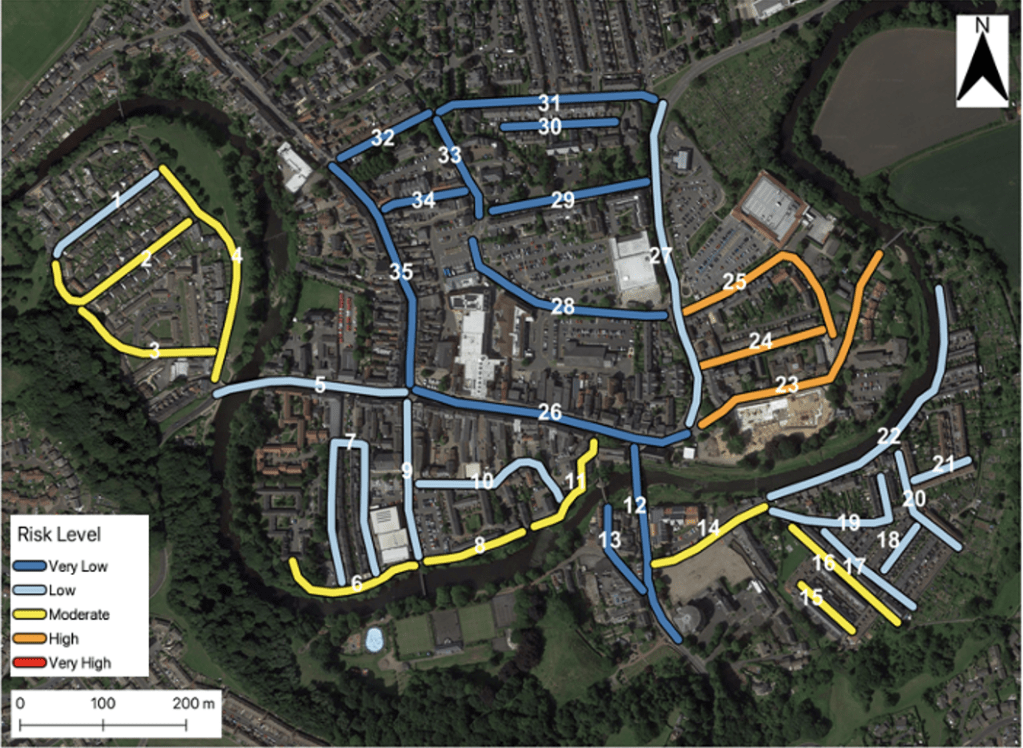
Figure 8: A flood risk map displaying the most and least affected streets of Morpeth during a >1% probability flood (Flood Zone 3)
4. Discussion
4.1 Hazard and Flood Magnitudes
It is clear from the results presented in Section 3.0, that during a 1-in-1000-year event (FZ2), more streets in Morpeth would be inundated and at a higher level of risk (Ridolfi et al., 2021). Large scale events such as a FZ2 scenario are projected to increase as a result of climate change, meaning more populations will be at risk of flooding in the near future (Prudhomme et al., 2010). Additionally, the repeated occurrence of a FZ3 magnitude flood still has the potential to cause serious impacts on Morpeth’s physical environment and surrounding populations due to the weakening of infrastructure and defences (Chen and Mehrabani, 2019).
4.2 Key Components of Vulnerability
In addition to flood magnitudes affecting risk, the most influential vulnerability components in Morpeth are high population densities, CI, and residents without vehicle access. The presence of residential properties highlights the exposure of populations in dangerous, flood prone areas (Custer and Nishijima, 2015; Karagiorgos et al., 2016). Congested neighbourhoods, such as the south and west of Morpeth, have been proven to be particularly susceptible to floods, increasing the risk of both short- and long-term consequences (Jasour et al., 2022). This emphasises the necessity to prepare for the rehoming of populations, a crucial consideration in the pre-planning stage of flood events (Felix et al., 2015). Furthermore, it is important to know the age of these congested populations due to both young children and the elderly potentially having difficulty responding to a disaster effectively on their own (Chang et al., 2021). This has been supported with findings suggesting most flood related fatalities are due to others travelling to aid the elderly evacuate (Ahmed et al., 2020). This highlights that identifying highly populated areas and understanding who populates them is crucial to mitigating flood risk effectively.
The results highlight CI as an important factor to monitor in Morpeth, as they are present in all streets considered to be at a high flood risk during both FZ2 and FZ3 events. These CI included a care home, ambulance station, supermarket, and NHS health centre. The presence of CI is also increasing due to rising population levels, suggesting that there is possibility for future populations to become more vulnerable and at-risk during flood events (Fekete et al., 2020). This causes an increase in impermeable surfaces, creating additional surface run off, further enhancing vulnerability to flood events (Wang et al., 2019). During both a FZ2 and FZ3 event, all streets regarded as high and low risk in Morpeth contain 80-100% impermeable surfaces. The consequence of this is that if a flooding event was to occur, there would be very low possibility for flood water to infiltrate, increasing the probability of property damage and the threat of human health (Bertilsson et al., 2019).
Additionally, if congested neighbourhoods contain lower income households, there are lower levels of disaster preparedness (Benevolenza and DeRigne, 2019). This can involve expenditure on insurance, an assistor in the restoration of damaged properties, as well as having vehicle access that can aid independent evacuation during a flood to an area that is deemed as safe i.e., enhancing resilience (Lamond et al., 2009). In Morpeth, the streets considered to be least resilient had populations without vehicle access and who were less economically active. Therefore, understanding flood resilience is vital, as those with low levels of resilience, have high levels of risk.
4.3 Considerations and Limitations
Great deliberation was taken upon choosing calculation techniques and characteristics to be measured. Indexing is the most favourable method of calculating flood risk and vulnerability as it allows the inclusion of multiple characteristics within one framework, whilst also ensuring a standardisation of data that can later be visualised through the production of maps (Percival and Teeuw, 2019). The choice of these characterises can be incredibly subjective, therefore, through literature reviews, the most predominant characteristics in current research were chosen for this research study (Balica, Wright and Van der Meulen, 2012; Percival and Teeuw, 2019). If this study was to be replicated, it would be recommended to consider measuring characteristics such as public transport (physical), average house prices (socio-economic) and emergency facilities (resilience). It could also be considered to try different weightings of characteristics to see how this influences results, although this would be recommended to be done through a team of researchers or stakeholders than by an individual.
5. Conclusion
This article has presented a unique methodology for the application of a high spatial resolution street level flood risk assessment during FZ2 and FZ3 events. The maps produced highlight streets in Morpeth that need most attention. It was determined that the characteristics that influence risk the most were complete flood water inundation, high numbers of residential properties, CI, and populations without vehicle access. It is also shown that a FZ2 event places more of the population at risk. These results help drive development of sound evacuation plans, a crucial development in areas such as Morpeth in order to heighten the safety of the community and future protection of the physical infrastructure. The findings from this study also highlight that to maintain a low level of vulnerability, it is essential FVI’s are frequently evaluated and adapted to ensure findings produce accurate methods of adaptation and mitigation. Theoretical and practical implications of these findings concern that it has been carried out on a street level scale and therefore findings may not be a representative of flood risk and vulnerability on a larger scale. Additionally, further vulnerability characteristics than what have been chosen for this study could have been measured, such as household composition (dependent children) and disabilities. This may have influenced findings and the overall level of flood risk in Morpeth. Nevertheless, this study and its findings are still considered to be an insightful contribution to the field of vulnerability and flood risk.
References
Ahmed, M.A., Haynes, K. and Taylor, M., 2020. Vehicle‐related flood fatalities in Australia, 2001–2017. Journal of Flood Risk Management, 13(3), p.e12616.
Balica, S., and Wright, N. G. (2010) Reducing the complexity of the flood vulnerability index. Environmental Hazards, 9(4), pp.321-339.
Balica, S.F., Popescu, I., Wright, N.G., & Beevers, L., 2013. Parametric and physical modelling techniques for flood risk and vulnerability assessment: A comparison. Environmental Modelling and Software 41, 84-92.
Balica, S. F., Wright, N. G., and Van der Meulen, F. (2012) A flood vulnerability index for coastal cities and its use in assessing climate change impacts. Natural hazards, 64(1), pp.73-105.
Benevolenza, M.A. and DeRigne, L. (2019) The impact of climate change and natural disasters on vulnerable populations: A systematic review of literature. Journal of Human Behavior in the Social Environment, 29(2), pp.266-281.
Bertilsson, L., Wiklund, K., de Moura Tebaldi, I., Rezende, O.M., Veról, A.P. and Miguez, M.G. (2019) Urban flood resilience–A multi-criteria index to integrate flood resilience into urban planning. Journal of Hydrology, 573, pp.970-982
Birkmann, J. (2006). Measuring vulnerability to promote disaster-resilient societies: Conceptual frameworks and definitions. Measuring vulnerability to natural hazards: Towards disaster resilient societies, 1, pp.9-54.
Chang, H., Pallathadka, A., Sauer, J., Grimm, N.B., Zimmerman, R., Cheng, C., Iwaniec, D.M., Kim, Y., Lloyd, R., McPhearson, T. and Rosenzweig, B. (2021) Assessment of urban flood vulnerability using the social-ecological-technological systems framework in six US cities. Sustainable Cities and Society, 68, p.102786.
Chen, H.P. and Mehrabani, M.B. (2019) Reliability analysis and optimum maintenance of coastal flood defences using probabilistic deterioration modelling. Reliability Engineering & System Safety, 185, pp.163-174.
Custer, R. and Nishijima, K. (2015) Flood vulnerability assessment of residential buildings by explicit damage process modelling. Natural Hazards, 78(1), pp.461-496.
DEFRA/Environment Agency. (2020) Flood Map for Planning (Rivers and Sea) – Flood Zone 2 – data.gov.uk [online] Available at: https://data.gov.uk/dataset/cf494c44-05cd-4060-a029-35937970c9c6/flood-map-forplanning-rivers-and-sea-flood-zone-2 [Accessed: 22.10.2020]
DEFRA/Environment Agency. (2020) Flood Map for Planning (Rivers and Sea) – Flood Zone 3 – data.gov.uk [online] Available at: https://data.gov.uk/dataset/bed63fc1-dd26-4685-b143-2941088923b3/flood-map-forplanning-rivers-and-sea-flood-zone-3 [Accessed: 22.10.2020]
Fekete, A. (2020) Critical infrastructure cascading effects. Disaster resilience assessment for floods affecting city of Cologne and Rhein‐Erft‐Kreis. Journal of Flood Risk Management, 13(2), p.e312600.
Félix, D., Monteiro, D., Branco, J.M., Bologna, R. and Feio, A. (2015) The role of temporary accommodation buildings for post-disaster housing reconstruction. Journal of Housing and the Built Environment, 30(4), pp.683-699.
Fernandez, P., Mourato, S., Moreira, M. and Pereira, L. (2016) A new approach for computing a flood vulnerability index using cluster analysis. Physics and Chemistry of the Earth, Parts A/B/C, 94, pp.47-55.
Jasour, Z.Y., Reilly, A.C., Tonn, G.L. and Ferreira, C.M. (2022) Roadway flooding as a bellwether for household retreat in rural, coastal regions vulnerable to sea-level rise. Climate Risk Management, 36, p.100425.
Google Earth (2021) Google Earth Pro [app] Available at: https://www.google.co.uk/earth/download/gep/agree.html [Accessed: 23.01.2021]
Javadinejad, S. (2011) The 2008 Morpeth Flood: Continuous Simulation Model for the Wansbeck Catchment. Ebook, Grin publication.
Karagiorgos, K., Thaler, T., Heiser, M., Hübl, J. and Fuchs, S. (2016) Integrated flash flood vulnerability assessment: insights from East Attica, Greece. Journal of Hydrology, 541, pp.553-562.
Kourgialas, N. N., and Karatzas, G. P. (2017) A national scale flood hazard mapping methodology: The case of Greece-Protection and adaptation policy approaches. Science of the Total Environment, 601, pp.441-452.
Kron, W. (2005) Flood risk= hazard• values• vulnerability. Water International, 30(1), pp.58-68.
Lamond, J.E., Proverbs, D.G. and Hammond, F.N. (2009) Accessibility of flood risk insurance in the UK: confusion, competition and complacency. Journal of Risk Research, 12(6), pp.825-841.
Percival, S. and Teeuw, R. (2019) A methodology for urban micro-scale coastal flood vulnerability and risk assessment and mapping. Natural Hazards, 97(1), pp.355-377.
Prudhomme, C., Wilby, R.L., Crooks, S., Kay, A.L. and Reynard, N.S. (2010) Scenario-neutral approach to climate change impact studies: application to flood risk. Journal of Hydrology, 390(3-4), pp.198-209.
Ridolfi, E., Mondino, E. and Di Baldassarre, G. (2021) Hydrological risk: modeling flood memory and human proximity to rivers. Hydrology Research, 52(1), pp.241-252.
Tascon-Gonzalez, L., Ferrer-Julià, M., Ruiz, M. and Garcia-Melendez, E. (2020) Social vulnerability assessment for flood risk analysis. Water, 12(2), p.558.
Toosi, A. S., Calbimonte, G. H., Nouri, H., and Alaghmand, S. (2019) River basin-scale flood hazard assessment using a modified multi-criteria decision analysis approach: A case study. Journal of Hydrology, 574, pp.660-671.
Wang, X., Kinsland, G., Poudel, D. and Fenech, A. (2019) Urban flood prediction under heavy precipitation. Journal of Hydrology, 577, p.123984.
Wilby, R. L., Beven, K. J., and Reynard, N. S. (2008) Climate change and fluvial flood risk in the UK: More of the same? Hydrological Processes: An International Journal, 22(14), pp.2511-2523.
#Write for Routes
Are you 6th form or undergraduate geographer?
Do you have work that you are proud of and want to share?
Submit your work to our expert team of peer reviewers who will help you take it to the next level.
Related articles
